
Dotplot, Histogram, Box Plot
Loading the math board and drawing, please wait…
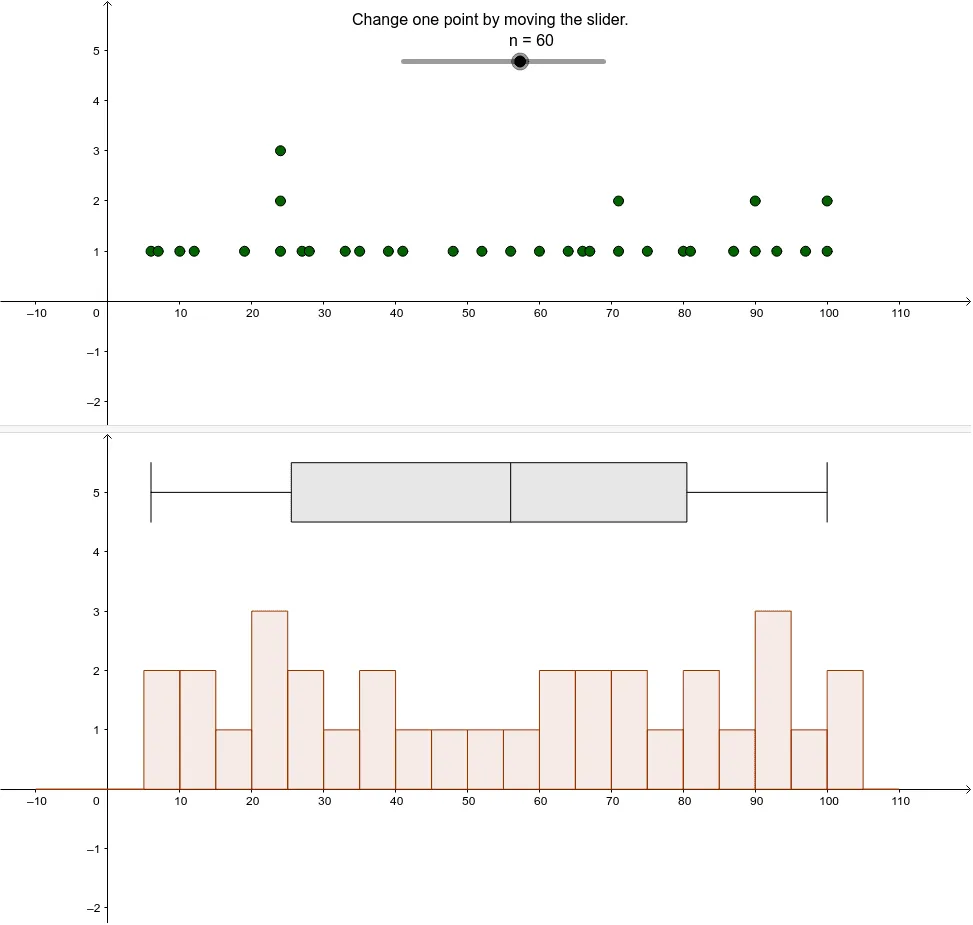
This example demonstrates how to use GeoGebra to create dotplots, histograms, and box plots for visualizing data distributions. Key math concepts include data visualization, statistical charts, and probability & statistics. It uses commands like DotPlot, Histogram, BoxPlot with objects n, A, B, L_1, a, b, text1. Suitable for high school students and educators.
GeoGebra Commands & Parameters
DotPlot(A) → L_1Histogram(B, A, false) → aBoxPlot(5, 0.5, A) → b
AI Drawing Prompt Reference
Create a set of visualizations including a dot plot, histogram, and box plot to display data distributions, where the dot plot is based on dataset 1, the histogram uses dataset 2 with frequencies from dataset 1, and the box plot is based on dataset 1 with 5 quartiles and a box width of 0.5, all sharing the same coordinate system and labeled with key statistical details.
The prompt above was compiled from the original drawing commands and is for reference only.