
Table to Scatter Plot: Identifying Variable Relationships and Trend Lines
Loading the math board and drawing, please wait…
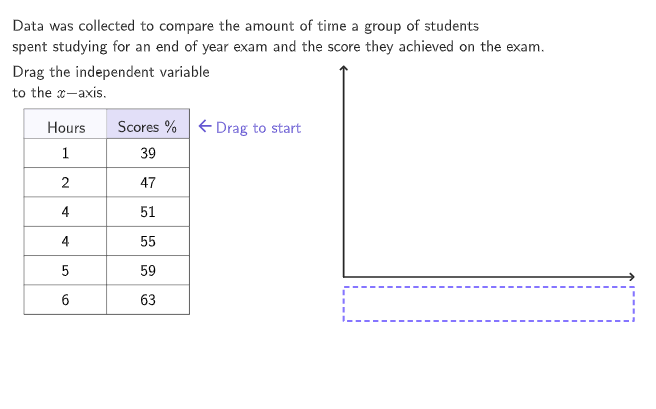
This example demonstrates how to convert a data table into a scatter plot, teaching students to identify dependent and independent variables and determine whether the relationship is positive, negative, or shows no correlation. Key mathematical concepts include labeling scatter plot axes correctly, plotting data points, approximating trend lines, and interpreting correlations. Construction highlights: Uses TableText to render tabular data, Sample and RandomUniform to generate random sample data points, Zip and Sequence to construct coordinate pairs, and Polygon to visualize data regions with interactive draggable elements for exploring different data distributions. Designed for grades 6-8 students in statistics and probability units, developing data analysis and visualization skills.
GeoGebra Commands & Parameters
RandomUniform(0, 0.99, 400) → allRandoms, {0.9294057287478594, 0.1321211127431961, 0.18473602354721605, 0.5213883994300303, 0.15089809311475713, 0.07616616444182976, 0.2985144370369922, 0.9482838448925606, 0.2895301751186992, 0.8104704639559568, 0.1523234706420959, 0.03211053171545286, 0.682209760787389, 0.02994822610885676, 0.6420335038325583, 0.5673648207265708, 0.13826791083611198, 0.33261095678209524, 0.8046651450789795, 0.514335246868874, 0.11812430123907386, 0.2081922831318171, 0.5843989670267391, 0.9804859763553179, 0.7005928839634215, 0.4734234158747672, 0.7623590270764886, 0.44930650362578767, 0.7983014543436712, 0.3910280545637683, 0.3184867485537182, 0.2896880590178682, 0.6161189585295899, 0.7135970971971709, 0.9384599575821412, 0.250946841325868, 0.3188407628151292, 0.4210333501005215, 0.23418846707747173, 0.7491129208462396, 0.2216784867608295, 0.6512224874804419, 0.39293099346989036, 0.7990388079532917, 0.8803321220919423, 0.39799173281037936, 0.19752932798265974, 0.2942550052226635, 0.9865929171030268, 0.7882587037667782, 0.3986446658060227, 0.8123101922016317, 0.9305323169546066, 0.4415524112050654, 0.6392068201635177, 0.7175818277309987, 0.6713779904778084, 0.17980573403153483, 0.5115509237484405, 0.026228496945048023, 0.47615932467506566, 0.6134719322667911, 0.2589173801995958, 0.969078381978881, 0.8581256088343231, 0.571610701411292, 0.3851293026920084, 0.5378087232356357, 0.20579714182704884, 0.8486176342903383, 0.24933824720383888, 0.737769504374108, 0.18830436048180646, 0.1687382676383623, 0.5267421951139596, 0.9072394080116404, 0.5534028186673166, 0.0014122467532378402, 0.4411315140342831, 0.11777587311540204, 0.35122126570986506, 0.025834395089116523, 0.39100662258662316, 0.6236316263549101, 0.1494082000541014, 0.2918995444403963, 0.7378379005739288, 0.21995721078833483, 0.6338864837710819, 0.7569137969527615, 0.3728016308219327, 0.11969574658472563, 0.2839084182404234, 0.9131106126859725, 0.6670270703681977, 0.927698417459083, 0.6505236406218476, 0.1801000220131826, 0.650028477556663, 0.5776501548293611, 0.47392939309809784, 0.44891052031773293, 0.021571964692005976, 0.16289255033231248, 0.42746762913714315, 0.7802484519179619, 0.963740831031825, 0.09616730532028289, 0.17426643674264192, 0.27900494979061413, 0.842414144985587, 0.2656757646516523, 0.13669206175031764, 0.47988168112849267, 0.7207621119947908, 0.8556612319135103, 0.13888637301246445, 0.40528657371864607, 0.3516875365942688, 0.6089686851146675, 0.03870888370424196, 0.8463667681853001, 0.04140724861010595, 0.586721545159684, 0.15738493684918253, 0.17120088218953386, 0.3325673951016209, 0.36637915283106776, 0.4530819064286215, 0.7807644406966966, 0.6424259993357823, 0.3039983085899826, 0.03849213694721604, 0.7533110804213341, 0.28971220536239223, 0.9495206031898967, 0.8322968946231154, 0.41127973530880546, 0.7427849139970086, 0.12534294393270232, 0.07011745736062439, 0.6117417242651478, 0.3816652533878304, 0.8483013368356516, 0.23222994443282535, 0.5617435576030244, 0.2074054200374425, 0.7835092122521287, 0.4029271462469255, 0.08368089751513501, 0.7640832492664408, 0.60523871046076, 0.7299566609025295, 0.24305532915391834, 0.7114748017609486, 0.9652196051263823, 0.04194575510277668, 0.8616205616494008, 0.07015916170903752, 0.26235359075118886, 0.7371443072846346, 0.8030159190266957, 0.8054476849372211, 0.6599013772577399, 0.33817428731238114, 0.2055146238004397, 0.9521065465121716, 0.5766993563552256, 0.05476880742086677, 0.8674809163061352, 0.8583549052252779, 0.15789704568294838, 0.29971687595303, 0.7755346855020537, 0.1650722861183215, 0.7380800904851047, 0.15239920896108713, 0.11326368434658599, 0.43453711462564526, 0.42545416968694516, 0.9894084308154665, 0.7896029663789065, 0.32234525122525054, 0.4200129645007738, 0.23279154027177465, 0.4607180246765904, 0.6064201298084927, 0.9312989784248837, 0.8834352114638572, 0.7373820629065633, 0.5082279270161856, 0.3824892854357519, 0.7800342188570007, 0.4514300756496208, 0.1934496051868543, 0.15709841694540735, 0.9429407589169807, 0.7599014125879946, 0.4024380355183621, 0.05258890539530744, 0.7969874235892996, 0.6039492221419567, 0.9048016436502337, 0.31161562756063693, 0.7781090763907477, 0.6714999982811201, 0.34740772036289974, 0.6565027239495261, 0.9252583451627913, 0.16798745698732362, 0.9709870237167006, 0.19586313483674492, 0.20171763182908148, 0.9882649933736496, 0.8273470820430838, 0.9440179150668241, 0.13845471968988513, 0.5950172581162366, 0.6569660617028897, 0.01405887654385427, 0.9166519620221508, 0.6046461111981203, 0.12543948979859798, 0.5140207351037469, 0.6769587295036426, 0.6006973999614473, 0.726891145951502, 0.5926893709673593, 0.35937435515001614, 0.8674252782465598, 0.06303577539399921, 0.2570713589947412, 0.4999634769331063, 0.6120563721654704, 0.9180943673998349, 0.5074849047567903, 0.6588386202089936, 0.3037213724494516, 0.2722146242778566, 0.5686056085338127, 0.2980141224897493, 0.9798632298357035, 0.7794373499136129, 0.8056113931419818, 0.4778433832784282, 0.14720960919806028, 0.3105760554846783, 0.2138180862764316, 0.8767962399078681, 0.3641156295199407, 0.5266403727462795, 0.527883715555843, 0.12131569042686044, 0.4642354270159115, 0.464635490167917, 0.9527817486033195, 0.6304129410236118, 0.9480744252072287, 0.8047080729498919, 0.143304890826578, 0.05351749736069863, 0.5890023891738138, 0.2556854697758978, 0.5118580995511132, 0.09989361060238758, 0.6537747776808859, 0.49506894549105235, 0.5557361678934163, 0.9336670690248512, 0.004513945778141123, 0.8394921623312959, 0.2949531643448086, 0.07017604750980537, 0.29944349820414917, 0.8625457297439956, 0.4400024773455257, 0.6569673898135652, 0.013448624259287324, 0.9086939022278764, 0.02567360863885439, 0.6963042696259921, 0.42675196765106244, 0.8247739074903429, 0.8522379435583558, 0.965533983780746, 0.8506483673967392, 0.704269027398394, 0.26893797799992525, 0.4870842730954474, 0.3933348462600791, 0.05418557074736222, 0.566776308411195, 0.8012141053625785, 0.026399771209549634, 0.2799399863526015, 0.3680972982449731, 0.16193981891040451, 0.693503760225424, 0.14017570015237465, 0.4893907819583201, 0.34978972212995085, 0.9071877426946389, 0.19088110433253133, 0.3711203135866557, 0.8042105152916426, 0.8075859959018189, 0.22656813435337086, 0.10418801613995202, 0.3735561689466787, 0.1981015436478726, 0.15559722449447055, 0.9168975663193625, 0.8316343500015365, 0.9678175427351839, 0.6169985588003948, 0.8389610045723127, 0.4867690647007498, 0.45857264466137393, 0.3973400306548856, 0.25021921881812637, 0.5122567271471221, 0.6362207738575398, 0.36833131494289806, 0.7913055971269205, 0.2759512898477671, 0.9706241268736999, 0.7189298207153219, 0.6514812715242024, 0.2315085682920754, 0.5973956850224588, 0.8797276016380886, 0.15530504140645893, 0.48455243153193645, 0.7163115055068995, 0.5323495299274656, 0.184674863783432, 0.7436952595206175, 0.9666549734432145, 0.012482142690245666, 0.3060877487765123, 0.738952885455744, 0.9385343955958699, 0.3419781166427332, 0.3647133923479987, 0.028638775613926228, 0.5314323271505411, 0.1332453538725631, 0.5370623061285421, 0.44030465983600386, 0.946898916072253, 0.4778309432040263, 0.20265192050152261, 0.4317152571790735, 0.12139387450878639, 0.26074843002701087, 0.6521351891960148, 0.7842012107628414, 0.8778104370101564, 0.05267378517915921, 0.7948539887979152, 0.41303026124995107, 0.08018206861839672, 0.163648260200504, 0.042715132214380815, 0.17766847969256538, 0.615476278529024, 0.3543781384739694, 0.3196600127070259, 0.9189734965074922, 0.9692222734147344, 0.9446097905668865, 0.9568093368320497, 0.32046917472407527, 0.16799825382786043, 0.3023846714307851, 0.14261237078142405, 0.20689578733995787, 0.05152103852424927, 0.7532425291868539, 0.15501602826866842, 0.865212724552379, 0.11023453945286005, 0.5546422332876457, 0.408791567791371, 0.7011499967537764, 0.11088646983342437, 0.35800865745774874, 0.9157180031743896, 0.418262880364189, 0.952610625127224, 0.42888942100151817, 0.37831840679260303, 0.22623837944093741, 0.8794998967376885, 0.8847199807588139, 0.37928199435765303, 0.1109352249194545, 0.5425591434164342, 0.7596460199219328, 0.19857666521510142}Take(allRandoms, randIndex, randIndex + numRandoms - 1) → currentRandomSeedsElement({randomSlope1, randomSlope2, 0}, randomProb) → randomSlopeIf(randomProb ≟ 1, 150 - floor((currentRandomSeeds(40) * 40)), 20 + floor((currentRandomSeeds(40) * 10))) → yIntIf(randomProb ≟ 1, 150, randomProb ≟ 2, 100, 30) → numMaxIf(randomProb ≟ 1, 5, multiplier) → roundingIf(randomProb ≟ 1, 40, randomProb ≟ 2, 20, 5) → numMinSample(Sequence[1, 10], 6, false) → sampleY1, {7, 1, 2, 6, 4, 9}Sample(Sequence[1, 10], 6, false) → sampleY2, {4, 1, 6, 3, 5, 7}Sample(Sequence[1, 10], 6, false) → sampleY3, {9, 2, 5, 10, 1, 3}Sample(Sequence[1, 10], 6, false) → sampleY4, {3, 7, 4, 8, 9, 10}Sample(Sequence[2, 5], 4, true) → sampleX1, {4, 3, 5, 3}Sample(Sequence[2, 5], 4, true) → sampleX2, {4, 4, 2, 5}Sample(Sequence[2, 5], 4, true) → sampleX3, {5, 5, 3, 3}Element({sampleY1, sampleY2, sampleY3, sampleY4}, 1 + Mod[countQuestion, 4]) → sampleYUnorderedElement({Reverse[Sort[sampleYUnordered]], Sort[sampleYUnordered], sampleYUnordered}, caseNum) → sampleYSort(Join[{{1, 6}, Element[{sampleX1, sampleX2, sampleX3}, 1 + Mod[countQuestion, 3]]}]) → sampleXElement({20, 40, 30}, caseNum) → yRangeElement({105, 35, 0}, caseNum) → yOffsetZip((A, (yRange * B / 10) + yOffset), A, sampleX, B, sampleY) → allPointsPolygon(polygonCoords) → dragAreaMidpoint(Vertex[dragArea, 1], Vertex[dragArea, 3]) → DragCenterIf(¬correctLabels, 1, 2) → stepIf(randomProb ≠ 2, ((42 + 2) * pixelHeightConvert), ((55 + 2) * pixelHeightConvert)) → titleHeightIf(randomProb ≟ 2, 0.2, 1) → scalingFactorPolygon(graphDimPoints) → graphAreaPolygon(Zip[PixelsToPoint[Corner[1], Corner[3], Corner[5], A], A, {(pixelsLeft, pixelsTop), (pixelsLeft, y(Corner[5]) - pixelsBottom), Corner[5] - (pixelsRight, pixelsBottom), (x(Corner[5]) - pixelsRight, pixelsTop)}]) → borderBoxCorner(5) → layoutAppSizeSegment((0, 0), (graphDims(3), 0)) → axisXSegment((0, 0), (0, graphDims(4))) → axisYZip(PixelsToPoint[(dimensions(1), dimensions(2)), (dimensions(3), dimensions(4)), (800, 500), TablePX + A], A, {(55, 35 / 2 + 5), (155, 35 / 2 + 5)}) → homePointsText(currentMoveLabel(1), PMoveX, true, true, 0, 0) → textLabelXIf(countQuestion ≟ 0, 1, 1 + floor((currentRandomSeeds(1) * 2))) → randomOrderSequence(Corner[textLabelX, n], n, 1, 4) → xLabelCornersIf(numTime ≤ 12, numTime + "\;am", numTime - 12 + "\;pm") → textTimeSequence(Text[If[randomProb ≟ 1, 10, 0] + (n * If[randomProb ≟ 1, 10, 1]), (n, (-0.5 * multiplier)), true, true, 0, -1], n, 1, 6) → textXAxis12Sequence(Text[ConvertTime[(2 * n) + 6], (n, 0), true, true, 0, -1], n, 1, 6) → textXAxis3If(caseNum < 3, textXAxis12, textXAxis3) → textXAxisAppend(((((("\cellcolor{" * If[step ≟ 2 ∨ PMoveX ≠ homePoints(1), "#FFFFFF", colorShade]) * "}") * If[PMoveX ≟ homePoints(1), "\phantom{", "{"]) * tableLabel(1)) * "}"), Zip[(((("\cellcolor{" * If[animateStage ≟ B, colorPinkLight, "#FFFFFF"]) * "}{") * textXAxis(x(A))) * "}"), A, allPoints, B, {1, 2, 3, 4, 5, 6}]) → col1Append(((((("\cellcolor{" * If[step ≟ 2 ∨ PMoveY ≠ homePoints(2), "#FFFFFF", colorShade]) * "}") * If[PMoveY ≟ homePoints(2), "\phantom{", "{"]) * tableLabel(2)) * "}"), Zip[(((("\cellcolor{" * If[animateStage ≟ B, colorPinkLight, "#FFFFFF"]) * "}{") * y(A)) * "}"), A, allPoints, B, {1, 2, 3, 4, 5, 6}]) → col2TableText(col1, col2, "vc_|", 100, 35) → displayTableMin(1, ((1 + animateControl - animateStage) * 1.5)) → animateValueTake(allPoints, 1, animateStage - If[animateValue ≟ 1, 0, 1]) → displayPointscenterBox(boxWidthX, boxHeightX, PMoveX) → moveLabelXcenterBox(boxWidthY, boxHeightY, PMoveY) → moveLabelYReplaceAll(tableLabel(2), "$", "\$") → yMoveLabelText(currentMoveLabel(2), PMoveY, true, true, 0, 0) → textLabelYVerticalText(currentMoveLabel(2)) → lblYText(currentMoveLabel(If[PMoveX ≟ DragCenter, 1, 2]), DragCenter, true, true, 0, 0) → axisLabelXZip(PulsePoint + (((A * xPX10) * 5), ((B * yPX10) * 1.75)), A, {-1, 1, 1, -1}, B, {-1, -1, 1, 1}) → onboardingCornersPolygon(onboardingCorners) → backgroundPulsingPolygon(onboardingCorners) → pulsingQuadPolygon({(dimensions(1), dimensions(2)), (dimensions(1), dimensions(4)), (dimensions(3), dimensions(4)), (dimensions(3), dimensions(2))}) → coverBox
AI Drawing Prompt Reference
Create a scatter plot to display a set of randomly generated data points. First, generate 400 random numbers between 0 and 0.99, then use these numbers to create corresponding y-axis intercepts and data points. Next, randomly select some x-axis and y-axis sample values, and use these values to generate specific points. Arrange these points according to a certain pattern. Finally, draw the x-axis and y-axis, add axis labels and tick marks, and show the distribution of the data points.
The prompt above was compiled from the original drawing commands and is for reference only.