
Rolling Two Dice - Sum Probability Exploration
Loading the math board and drawing, please wait…
In collections
Probability and Statistics
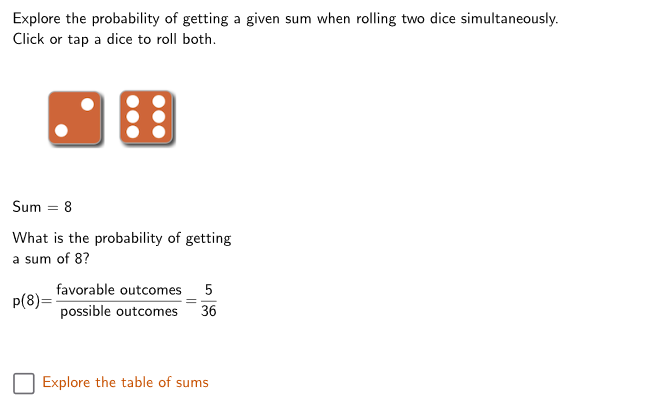
This example demonstrates the probability distribution of the sum when rolling two dice. It involves core math concepts like Probability & Statistics, Random Variables, and Expected Value. Construction highlights include using TableText to display text, objects like d1, d2 for dice values, fig series for graphics, and variables like fav, poss, a, tot for probability calculations. Suitable for high school students learning probability statistics for practice and exploration.
GeoGebra Commands & Parameters
TableText({{A1, B1, C1, D1, E1, F1, G1}, {A2, B2, C2, D2, E2, F2, G2}, {A3, B3, C3, D3, E3, F3, G3}, {A4, B4, C4, D4, E4, F4, G4}, {A5, B5, C5, D5, E5, F5, G5}, {A6, B6, C6, D6, E6, F6, G6}, {A7, B7, C7, D7, E7, F7, G7}}, "|_ccccccc", 50, 50) → testo7
AI Drawing Prompt Reference
Create a probability distribution graph for the sum of two dice rolls. First, create the values of two dice, then calculate their sum, and use a table to display all possible sums and their probabilities. Finally, represent the probability distribution with a bar chart.
The prompt above was compiled from the original drawing commands and is for reference only.