
Percentages, Equivalent Fractions, and Decimals
Loading the math board and drawing, please wait…
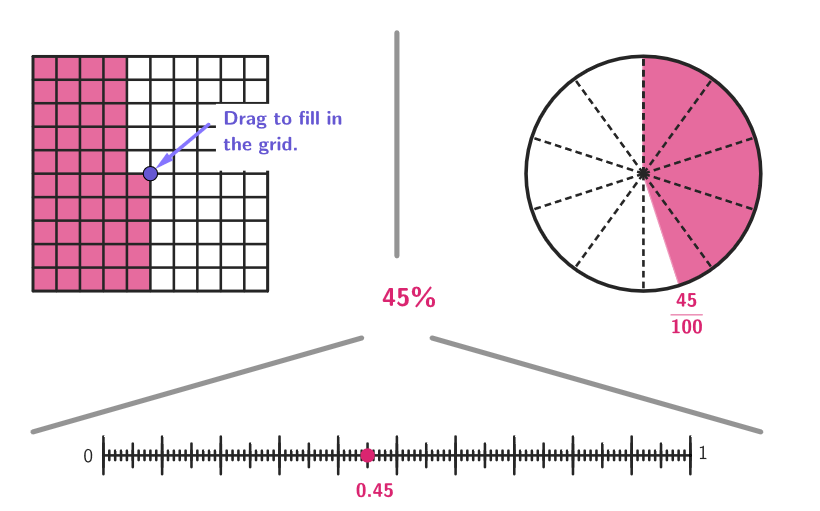
Explore the meaning of a percentage by relating them to fractions and decimals. Represent percentages with a grid model, a pie chart, and a number line. This example demonstrates the concept of percentages and their equivalent forms using visual models. Key math concepts include percentages, fractions, decimals, and their conversions. Constructed using GeoGebra commands like Polygon, Grid, Segment, Circle. Suitable for grades 6-8, focusing on number sense and modeling skills.
GeoGebra Commands & Parameters
Midpoint(G, U) → VPolygon(A, B, 4) → poli1Border, f, g, h, i, C, DPoint(megaGrid) → ENDPolygon(A, L, END, I, K, D) → quadPoli, l, q, s, t, a, bArea(quadPoli) → valueSequence((k, y(E)), k, x(E), x(F), Distance[E, F] / 100) → ptGridPolygon(A, B, 4) → poli1Fill, j, m, n, p, M, NMirror(P1, yAxis) → P1'Mirror(P1', xAxis) → P1''Mirror(P1'', yAxis) → P1'''Polygon(P1, P1', P1'', P1''') → peep, p1, p1', p1'', p1'''Segment(E, F) → segmDecSequence(Segment[(t, y(E) - 0.8), (t, y(E) + 0.8)], t, x(E), x(F), Distance[E, F] / 10) → longTicks1Sequence(Segment[(t, y(E) - 0.5), (t, y(E) + 0.5)], t, x(E), x(F), Distance[E, F] / 20) → mediumTicks1Sequence(Segment[(t, y(E) - 0.2), (t, y(E) + 0.2)], t, x(E), x(F), Distance[E, F] / 100) → shortTicks1Sequence(E + (k / 100 * (F - E)), k, 0, 100) → segmGridZip({Segment[(k, 0), (k, 10)], Segment[(0, k), (10, k)]}, k, 1…10) → squareDivVector(O, R) → vCircle(CC, 5) → cRadius(c) → rSequence(Rotate[CV, ((-t) * (360°) / 100), CC], t, 0, 99) → allCfrSegment(CC, CV) → kSequence(Segment[Rotate[CC, t, CC], Rotate[CV, t, CC]], t, 0°, 360°, 36°) → allRadLength(allCfr) → lengRotate(CV, ((-value) * (360°) / 100), CC) → CPSector(c, CP, CV) → fracSectCircle(CC, 5) → cFillIf(20 ≤ value ≤ 50, CP + UnitVector[Segment[CC, CP]], CP + (1.5 * UnitVector[Segment[CC, CP]])) → LP1Point(yAxis) → HMirror(H, x = x(V)) → H'Segment(P, Q) → sep1Vector(S, END + (0.2, 0.2)) → uSegment(W, H) → sep2Segment(Z, H') → sep3
AI Drawing Prompt Reference
Please draw a graphic that illustrates the equivalence of percentages, fractions, and decimals. The graphic should include three main parts: a grid model to visually represent percentages, a pie chart to show the proportion of percentages in a whole, and a number line to represent the numerical changes of percentages. Additionally, the graphic should clearly show the conversion relationships between percentages, fractions, and decimals to help understand the connections between these mathematical concepts.
The prompt above was compiled from the original drawing commands and is for reference only.