
Testing Solutions of a System: Line–Parabola Intersections
Loading the math board and drawing, please wait…
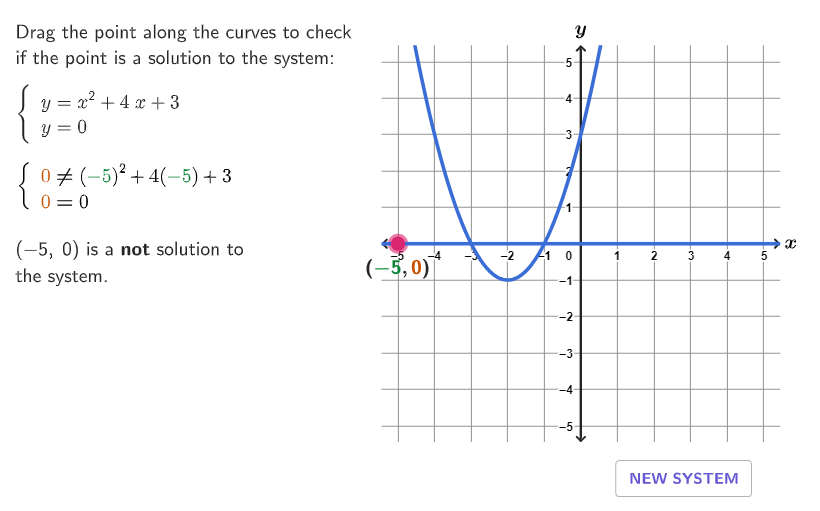
This GeoGebra example visualizes how the intersection points of a line and a parabola correspond exactly to the solutions of a system of equations. Students test whether a given coordinate pair satisfies both equations, reinforcing the equivalence between “graph intersections” and “system solutions.” Key concepts include systems of linear and quadratic (nonlinear) equations, solution verification via substitution, and interpreting intersection counts/locations on function graphs. Construction-wise, it leverages randomized parameter generation (RandomUniform, Sequence, Flatten, KeepIf, First, Element) to create multiple equation scenarios, forms the needed polynomial expressions (Polynomial), filters and manages candidate sets (RemoveUndefined, KeepIf, First, Element), and then constructs geometric/graphical elements such as points and connecting segments/polygons (Point, Segment, Polygon). It also uses text handling and layout adjustments (Text, Translate, Rotate, PointToPixels, Unicode conversions) to present interactive questions and feedback. Suitable for Grades 9–12 and for algebra/graphing lessons on solving systems with nonlinear relationships.
GeoGebra Commands & Parameters
RandomUniform(0, 0.99, 200) → allRandomSeeds, {0.3853180500635086, 0.36786167154423083, 0.3314899008851462, 0.4495898113206599, 0.7062391257328886, 0.8344662421036378, 0.22918499003983894, 0.079953373668172, 0.5209780387007789, 0.2735134895943693, 0.659835476913766, 0.967471125139848, 0.5120405543162071, 0.1878068650045772, 0.6425084400793382, 0.05588990138577263, 0.4953026774237742, 0.7183547614533085, 0.10065415855108611, 0.12190724108639135, 0.46657363747713015, 0.09996257148366718, 0.04575802394282447, 0.43279546821414605, 0.37009188346240574, 0.5989118343857159, 0.042775727967683516, 0.057192155759809384, 0.16583040117625739, 0.9570412333769425, 0.9465084403228637, 0.13030071971067922, 0.24978184743771492, 0.9075109935373384, 0.7045874813545581, 0.05368030705223599, 0.2946271074230456, 0.5419369083262746, 0.3601895579299874, 0.47717719899975675, 0.047360163846397525, 0.6364216641360324, 0.42599246493367715, 0.49636025224367125, 0.7255501132793349, 0.4852904008168496, 0.17020696371094612, 0.8630713760975706, 0.2949656216956968, 0.8060545266884918, 0.20578439475788265, 0.14938727586437156, 0.7782699518674823, 0.3772818878654581, 0.6151008159092369, 0.6764119364169152, 0.8474144590598995, 0.5026433736480894, 0.4945569316821931, 0.8788794980173206, 0.59121552213518, 0.17943497813249068, 0.6666095909109567, 0.014545867254726947, 0.5143955823687387, 0.7383414722488786, 0.27076389491749814, 0.5537822050632526, 0.8251006613729599, 0.14311221126100332, 0.6000063344053986, 0.8096572620167068, 0.9045767386008041, 0.5141610333228498, 0.7550481961898011, 0.6421051872673396, 0.1452955256899183, 0.5588815063611642, 0.32557430822251276, 0.3615242998449608, 0.19236383877319874, 0.403686395897923, 0.5254561443006815, 0.8173375766516967, 0.07753449923805626, 0.9384331312550346, 0.167589414718326, 0.20566825401832536, 0.3855556790631602, 0.512990051095077, 0.7236547324624096, 0.657345154054686, 0.34895331555338516, 0.45822713658840786, 0.1346765629852131, 0.03294997941523795, 0.43963641285045596, 0.7096812373691975, 0.679768801613856, 0.055554419487152104, 0.7439471339324176, 0.751550892809333, 0.9029070120825964, 0.08416806433218435, 0.28194746681066213, 0.3715171526213953, 0.17095550768875775, 0.11172850542769515, 0.011842158323222383, 0.5031661504187364, 0.08050415798403343, 0.050713469981225764, 0.46648171904084434, 0.10250608003896008, 0.026333037675006634, 0.5771394263011324, 0.4308726965472317, 0.2582256671768807, 0.34052455602580245, 0.5798355879431913, 0.24754152170663296, 0.19193233304528523, 0.9583809508039988, 0.07644130859383882, 0.1504559449119155, 0.46463887430359946, 0.7153818447069626, 0.8605739414379827, 0.078003319807534, 0.7392325448742443, 0.7484292888627293, 0.6260493825170392, 0.23125675745817487, 0.7655663819455766, 0.01458028148917782, 0.8639105565775459, 0.9254306477034889, 0.6951532007752785, 0.06135351479645739, 0.3963295345693092, 0.09003439723565104, 0.8862227885725366, 0.9845254900616076, 0.2281976794035199, 0.9667777165460659, 0.24711896049190493, 0.6820926670050901, 0.4924026634559002, 0.8437637722602729, 0.7366679560032785, 0.11677929936887324, 0.878415370678109, 0.3699261634972961, 0.33424136660083476, 0.014107825381487528, 0.29586926568250166, 0.6550229543932176, 0.5697657205264075, 0.7286260452090852, 0.9153137796234563, 0.3677965636653318, 0.25489798055142204, 0.7773979888279198, 0.7072580433404932, 0.08813947641953399, 0.300990563244363, 0.06731741385395901, 0.22799466545844002, 0.8982774600418089, 0.5173110772999231, 0.6411907332136443, 0.2265040415381253, 0.0930874194717725, 0.31426121748167213, 0.43686313211333155, 0.9109870785692942, 0.3407136820198115, 0.5110562870537999, 0.03392463886871422, 0.7362605431830888, 0.23162763117929844, 0.38548122743686586, 0.5437345464157332, 0.6643716152654024, 0.13719637585395444, 0.6249301011143797, 0.29064089345735833, 0.5003493655701663, 0.057683094064709575, 0.5329662399111396, 0.7253483731991004, 0.3730081800848912, 0.5043968200605479, 0.8641065491962815, 0.1854010076935218, 0.6471546642323245, 0.8714417624398099, 0.9214374458311377, 0.5326978623373068, 0.7784216917295964}Take(allRandomSeeds, randIndex, randIndex + numRandoms - 1) → currentRandomSeedsIf(-4 + floor((currentRandomSeeds(2) * 8)) ≠ 0, -4 + floor((currentRandomSeeds(2) * 8)), 1) → yVElement(coeffsA, Mod[floor((currentRandomSeeds(3) * 10)), Length[coeffsA]] + 1) → coeffASequence(xA + (0.5 * ii), ii, 1, Min[10 - (2 * xA), 6]) → xBPos, {-1.5, -1, -0.5, 0, 0.5, 1}Element(xBPos, xBind) → xBFlatten(Sequence[Sequence[(ii, jj), ii, -4, 4], jj, If[coeffA ≤ 0, -5 - coeffA, -4], If[coeffA ≥ 0, 5 - coeffA, 4]]) → PossibleVerticesElement(PossibleVertices, floor((currentRandomSeeds(2) * Length[PossibleVertices])) + 1) → VertPolynomial(g0) → gIf(countQuestion ≟ 0, 2, If[currentRandomSeeds(1) ≤ 0.8, 2, 1]) → NumOfSolsKeepIf(y(PP) ≟ g(x(PP)), PP, Flatten[Sequence[Sequence[(ii, jj), ii, -5, 5], jj, -5, 5]]) → PossibleSolsElement(PossibleSols, 1 + floor((Length[PossibleSols] * currentRandomSeeds(4)))) → Sol1Element(PossibleSols \ {Sol1}, 1 + floor(((Length[PossibleSols] - 1) * currentRandomSeeds(4)))) → Sol2First({Sol1, Sol2}, NumOfSols) → solsCorner(5) → layoutAppSizePointToPixels(Corner[onboardingDisplayText, 2], Corner[1], Corner[3], Corner[5]) → layoutOnboardingonboardingTextOffset(Corner[onboardingText, 1], Corner[onboardingText, 3], onboardingCase, Corner[1], Corner[3], Corner[5]) → OnboardingTextOffsetPolygon({(-5.5, -5.5), (5.5, -5.5), (5.5, 5.5), (-5.5, 5.5)}) → q1Flatten(Sequence[Sequence[y = (mm * x) + bb, mm, -5, 5], bb, -5, 5]) → LinesZip(RemoveUndefined[{Intersect[g, ll]}], ll, Lines) → l2RemoveUndefined(Zip[If[Length[ll] ≟ 0, LL, NaN], ll, l2, LL, Lines]) → l3Element(l3, 1 + floor((currentRandomSeeds(1) * Length[l3]))) → jPolynomial(Element[{h0, h1, h2}, NumOfSols + 1]) → hSegment((0, -5.42), (0, 5.42)) → iText("\math{x}", (5.75, 0.075), true, true, 0, 0) → labelxText("\math{y}", (0, 5.9), true, true, 0, 0) → labelyTranslate(p, Vector[(Vector[Corner[1], Corner[4]] / 500 * 16)]) → p'Sequence(Segment[(ii, -0.05), (ii, 0.05)], ii, -5, 5, 0.5) → l1Rotate(i, 90°) → i'Text((((((((("(\textcolor{" * colorx) * "}{") * x(Sol2)) * "},\textcolor{") * colory) * "}{") * y(Sol2)) * "})"), Sol2, true, true, 0, If[y(Sol1) ≥ y(Sol2), -1, 1]) → labelP2Text(g) → gtextKeepIf(abs(y(PP)) ≤ 5, PP, Sequence[(ii, g(ii)), ii, -5, 5, 0.01]) → Points1KeepIf(abs(y(PP)) ≤ 5, PP, Sequence[(ii, h(ii)), ii, -5, 5, 0.01]) → Points2Sort(Join[{Points1, Points2}]) → PointsPoint(Points) → ADerivative(g) → fTextToUnicode(gtext) → gtextUnicUnicodeToText(Flatten[Zip[If[nn ≟ 120, TextToUnicode[xsubstitute], {nn}], nn, gtextUnic]]) → text2Text(h) → htextSplit(htext, {"x"}) → htextSplitAppend(Zip[tt + xsubstitute, tt, First[htextSplit, If[h(0) ≟ 0 ∧ Slope[h] ≠ 0, Length[htextSplit], Length[htextSplit] - 1]]], If[h(0) ≟ 0 ∧ Slope[h] ≠ 0, "", htextSplit(-1)]) → htextSubstUnicodeToText(Flatten[Zip[If[nn ≟ 120, TextToUnicode[xsubstitute2], {nn}], nn, gtextUnic]]) → gtextSubstFinal2Append(Zip[tt + xsubstitute2, tt, First[htextSplit, If[h(0) ≟ 0 ∧ Slope[h] ≠ 0, Length[htextSplit], Length[htextSplit] - 1]]], If[h(0) ≟ 0 ∧ Slope[h] ≠ 0, "", htextSplit(-1)]) → htextSubst2Text((((((((("(\textcolor{" * colorx) * "}{") * x(A)) * "},\textcolor{") * colory) * "}{") * y(A)) * "})"), A - (0, 0.15), true, true, 0, -1) → labelAcirclePixels(A, 7 + (7 * pulsing), Cor1, Cor3, (800, 500)) → c
AI Drawing Prompt Reference
Draw a coordinate system with a randomly generated line and a parabola, highlighting their intersection points with dots. Display the equations of both functions in the graph, and label the coordinates of the two intersection points in different colors. The background features a light gray bordered rectangle, with tick marks on the axes and variable labels on them.
The prompt above was compiled from the original drawing commands and is for reference only.