
Scatter Plot Creation: Random Point Generation and Visualization
Loading the math board and drawing, please wait…
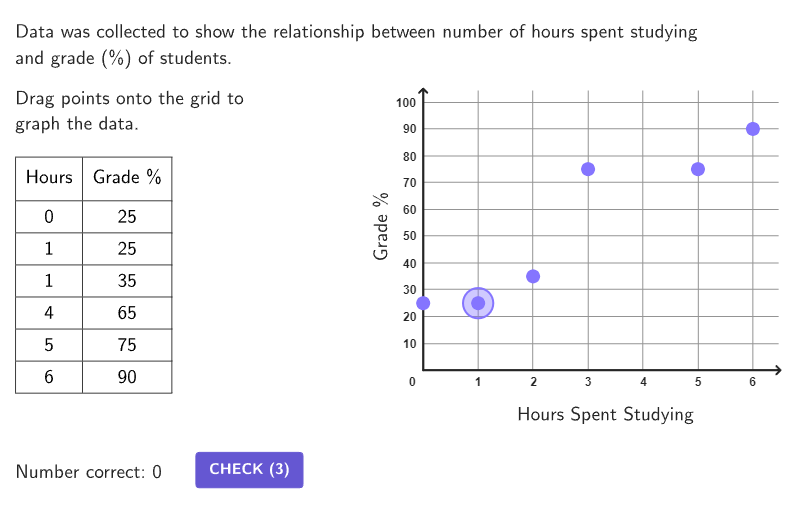
This GeoGebra example demonstrates how to create scatter plots and visualize randomly generated coordinate data points. Key mathematical concepts include coordinate planes, random number generation, point sequence operations, and statistical data visualization. Construction highlights: using Random commands to generate coordinate data, creating point objects via Sequence and Zip, organizing data with Flatten, sorting and deduplicating with Sort and Unique, drawing characteristic lines with Polygon and Segment, and adding interactive animations through Sliders. Suitable for secondary school statistics and probability teaching, introductory data analysis for college prep, and GeoGebra command learning practice.
GeoGebra Commands & Parameters
Flatten(Sequence[Sequence[1, 3], n, 1, 33]) → randomProbsElement(randomProbs, Mod[countQuestion, 99] + 1) → randomProbPixelsToPoint(Corner[1], Corner[3], Corner[5], (11 + 5, 154)) → CornerLeftTableShuffle(Sequence[Random[-100, 100] / 10, i, 1, 102]) → randomMult, {-2.3, -2.3, -4.8, 6.5, 5.9, 2.9, -7.7, -3.5, 5.7, 2.9, 2.2, -0.3, 7.7, 0.5, -1.7, -1.3, -9.9, -5.3, -5.2, -9.2, 7.3, 4.3, 0.7, 6.1, 4.5, -0.4, -9.7, 9.3, 2.8, 4.7, -9.3, -8.6, -8, -2.1, -1.5, 6.1, 4.6, 4, -2.2, -2.9, 9.5, 8.4, -1, 3.8, -4.2, -5.7, 6.9, -8.4, -7.9, 5.2, 2.3, -5.2, -6.9, -5, -2, 0.9, -3.8, -6.7, 8.5, 6.4, 0, -4.2, -5.7, 8, 2.5, 1.6, 5.9, -3.1, 3.1, 9.5, -4.5, -7.7, -0.7, 6, 4.9, -5.4, -3.7, 6.9, -0.6, 7.4, -3.3, -9, 5.5, -1, -0.6, -1.9, -0.3, 2.7, -7.1, -0.2, 8.5, 10, 9.4, -6.1, 1.8, 5, 4, 1.2, 9.1, -8.5, -6.9, -1.8}Shuffle(Sequence[Random[10, 20], i, 1, 102]) → randomRecip, {19, 13, 19, 13, 17, 10, 18, 18, 10, 17, 20, 15, 18, 11, 19, 17, 19, 14, 13, 19, 20, 14, 17, 15, 17, 18, 14, 12, 17, 14, 18, 15, 20, 12, 10, 15, 14, 20, 11, 14, 12, 15, 12, 14, 11, 13, 16, 13, 10, 17, 14, 18, 13, 16, 13, 19, 19, 12, 19, 20, 13, 17, 14, 12, 10, 17, 16, 14, 13, 13, 17, 13, 16, 15, 18, 18, 15, 10, 13, 12, 12, 11, 13, 11, 19, 19, 16, 11, 14, 17, 18, 20, 13, 16, 15, 15, 17, 14, 11, 18, 15, 17}Shuffle(Sequence[Random[0, 60] / 10, i, 1, 102]) → randomXH, {3.8, 1.2, 0.5, 4.5, 5.7, 0.4, 1.5, 6, 0.6, 3, 0.5, 4, 1.3, 2.8, 5.7, 2.3, 3.9, 3.1, 0.8, 5.3, 5.9, 0, 1, 1.2, 1.9, 0.8, 4.3, 3.3, 4.4, 5.3, 2.4, 2.3, 2.2, 0.7, 4.9, 1.2, 4.9, 0.6, 1.5, 0, 2.8, 4.4, 0.2, 5, 3.3, 2.9, 1.1, 0.8, 2.1, 5.3, 5.4, 2.1, 0.2, 2.2, 5.4, 3.5, 1.9, 2.2, 4.8, 5.3, 0.8, 0.6, 2, 0.3, 5.6, 0, 0.3, 0.9, 2.3, 3.3, 3.7, 5.9, 2.4, 4.2, 4.1, 4.3, 0.4, 1.1, 0.6, 2.3, 3.3, 5.4, 1, 1, 4.4, 2.2, 1.3, 0.7, 0.7, 1.5, 5.9, 4.9, 4.9, 4, 5, 4.1, 3.6, 0.5, 6, 0.1, 0.2, 4.4}Shuffle(Sequence[Random[100, 138] / 10, n, 1, 100]) → randomSlopes1, {12.5, 12.6, 12.9, 13.7, 10.2, 13.6, 11.2, 11.3, 12.5, 10.9, 12.7, 12.2, 12.2, 13.3, 11.7, 10.4, 13, 10.7, 10.3, 12.2, 12.5, 12.7, 13, 12.4, 12.4, 10, 11.5, 11.9, 10.7, 10.5, 10, 12.9, 12.5, 12.6, 12.1, 11.1, 13.1, 10.8, 12.7, 10.3, 10.4, 11.7, 13, 13.4, 13.2, 11.6, 13.6, 13.2, 11.2, 10.3, 10.4, 13.2, 11.7, 12.2, 10.2, 13.8, 12.8, 12, 13.3, 10, 13.3, 11.9, 11.3, 11.6, 12.3, 11.7, 11.8, 11.4, 11.8, 13.5, 12.7, 12.4, 10.7, 12.6, 13.1, 13, 11, 12.8, 10.6, 12, 12.8, 11.4, 12.9, 11, 11.6, 11.9, 12.2, 13.2, 13.5, 12.6, 13.7, 13.1, 12.4, 12.4, 12.7, 10.4, 11.7, 10.3, 11.8, 12.6}Element(randomSlopes1, Mod[countQuestion, 100] + 1) → randomSlope1Shuffle(Sequence[Random[-32, -20] / 10, n, 1, 100]) → randomSlopes2, {-2.9, -2.2, -2.7, -2.8, -2.8, -2.9, -2.7, -2.9, -3.2, -2.2, -2.7, -2.4, -2.8, -2, -3, -2.3, -2.8, -3.1, -2, -2.1, -2.9, -2.7, -2.2, -2.4, -2.7, -2.8, -2.5, -2.4, -2.4, -2.1, -2, -2.2, -2.9, -2.3, -2.9, -2.7, -2.9, -2.6, -2.9, -2.6, -2, -2.8, -2, -2.9, -3.1, -2.5, -2.8, -3, -2, -2.8, -3, -2.2, -3, -2, -2.4, -2.9, -2.4, -2.4, -2.2, -2.2, -2.5, -2, -2.6, -3.2, -2.3, -2.7, -2.2, -3.2, -3.1, -2.8, -3.1, -2, -2.3, -2.5, -2.9, -2, -2.7, -2.1, -2.4, -3, -2.2, -2, -2.4, -2.7, -2.2, -2.3, -2.1, -2.9, -2.4, -3.1, -2.4, -2.9, -2.3, -3.2, -2.4, -2.1, -3, -2.3, -2.6, -2.7}Element(randomSlopes2, Mod[countQuestion, 100] + 1) → randomSlope2Shuffle(Sequence[Random[1, 6], n, 1, 102]) → problem3x, {6, 5, 3, 5, 3, 4, 4, 2, 5, 2, 6, 1, 2, 1, 4, 1, 6, 4, 1, 5, 2, 5, 6, 5, 2, 4, 6, 6, 3, 3, 4, 3, 6, 5, 5, 5, 3, 6, 6, 5, 6, 4, 6, 5, 4, 1, 1, 2, 4, 2, 6, 1, 3, 4, 6, 1, 4, 4, 5, 4, 5, 3, 4, 4, 4, 1, 5, 3, 4, 5, 2, 2, 5, 2, 4, 3, 2, 2, 6, 5, 5, 5, 5, 2, 1, 1, 5, 5, 3, 6, 6, 2, 3, 1, 5, 6, 1, 4, 1, 1, 5, 5}Shuffle(Sequence[(round(Random[20, 100] / 5) * 5), n, 1, 102]) → problem3y, {60, 25, 40, 85, 70, 40, 45, 35, 65, 20, 20, 80, 75, 55, 85, 65, 60, 100, 25, 45, 85, 60, 95, 85, 65, 95, 45, 45, 60, 95, 40, 40, 65, 95, 55, 45, 90, 80, 20, 65, 65, 90, 75, 80, 100, 40, 80, 90, 50, 45, 65, 65, 100, 55, 70, 40, 50, 60, 35, 30, 40, 75, 35, 90, 30, 35, 25, 85, 25, 40, 65, 75, 40, 80, 40, 50, 30, 85, 25, 75, 100, 50, 90, 45, 55, 25, 35, 25, 70, 85, 35, 20, 30, 80, 35, 65, 95, 25, 25, 70, 40, 60}Unique(randomPoints3) → randomPoints3ULength(randomPoints3U) → lengthUnique3If(6 < Mod[(6 * (countQuestion + 1)), lengthUnique3] < lengthUnique3, Take[randomPoints3U, Mod[(6 * countQuestion), lengthUnique3] + 1, Mod[(6 * (countQuestion + 1)), lengthUnique3]], Mod[(6 * (countQuestion + 1)), lengthUnique3] ≟ 0, Last[randomPoints3U, 6], Join[{Last[randomPoints3U, 6 - Mod[(6 * (countQuestion + 1)), lengthUnique3]], First[randomPoints3U, Mod[(6 * (countQuestion + 1)), lengthUnique3]]}]) → uniqueRandomPoints3If(randomProb ≠ 2, ((42 + 2) * pixelHeightConvert), ((55 + 2) * pixelHeightConvert)) → titleHeightIf(randomProb ≟ 2, 20, 100) → numMaxIf(randomProb ≟ 1, randomSlope1, randomProb ≟ 2, randomSlope2, 0) → randomSlopeZip((n, guideLine(n) + c / k), n, randomXH, c, randomMult, k, randomRecip) → problemPoints12Zip((round(x(n)), (round((y(n) * If[randomProb ≟ 2, 1, 0.2])) * If[randomProb ≟ 2, 1, 5])), n, problemPoints12) → problemPoints12RoundedUnique(KeepIf[y(n) < numMax, n, problemPoints12Rounded]) → problemPoints12ULength(problemPoints12U) → lengthUnique12If(6 < Mod[(6 * (countQuestion + 1)), lengthUnique12] < lengthUnique12, Take[problemPoints12U, Mod[(6 * countQuestion), lengthUnique12] + 1, Mod[(6 * (countQuestion + 1)), lengthUnique12]], Mod[(6 * (countQuestion + 1)), lengthUnique12] ≟ 0, Last[problemPoints12U, 6], Join[{Last[problemPoints12U, 6 - Mod[(6 * (countQuestion + 1)), lengthUnique12]], First[problemPoints12U, Mod[(6 * (countQuestion + 1)), lengthUnique12]]}]) → uniqueRandomPoints12If(randomProb ≟ 3, uniqueRandomPoints3, uniqueRandomPoints12) → randomPointsSort(Zip[(round(x(n)), If[y(n) < 0, 0, y(n)]), n, randomPoints]) → randomPointsRoundedIf(randomProb ≟ 2, 0.2, 1) → scalingFactorFlatten(Sequence[Sequence[(n / 2, ((5 * m) * scalingFactor)), n, -6, 12], m, 0, 20]) → DragPointsPoint(DragPoints) → InputPoint1Point(DragPoints) → InputPoint6Point(DragPoints) → InputPoint5Point(DragPoints) → InputPoint4Point(DragPoints) → InputPoint3Point(DragPoints) → InputPoint2Zip((x(n), y(n)), n, answerInput1) → answerInputKeepIf(¬(n ∈ answerInput), n, randomPointsRounded) → errorListPolygon({(-2.5, (105 * scalingFactor)), (-2.5, (-1 * scalingFactor)), (6.5, (-1 * scalingFactor)), (6.5, (105 * scalingFactor))}) → DragAreaSort(answerInput) → answerInputSortedZip(n ∈ randomPointsRounded, n, answerInput) → boolCorrectsZip(abs(y(m) - y(n)), m, answerInputSorted, n, randomPointsRounded) → solutionYDifferencesZip(abs(x(m) - x(n)), m, answerInputSorted, n, randomPointsRounded) → solutionXDifferencesZip(n ≟ 0 ∧ m ≤ (2 * scalingFactor), n, solutionXDifferences, m, solutionYDifferences) → boolCorrectPointsPolygon(graphDimPoints) → graphAreaShuffle(Sequence[Random[20, 100], n, 1, 100]) → randomList2, {63, 23, 32, 22, 54, 56, 94, 40, 28, 86, 28, 36, 100, 30, 71, 21, 72, 47, 52, 75, 49, 65, 75, 35, 88, 74, 82, 32, 53, 38, 30, 98, 38, 100, 39, 72, 85, 95, 94, 73, 84, 23, 62, 34, 23, 30, 80, 68, 41, 92, 60, 71, 25, 92, 71, 61, 99, 79, 87, 98, 55, 64, 64, 33, 85, 96, 20, 63, 64, 79, 23, 61, 41, 96, 76, 24, 41, 60, 96, 41, 84, 52, 95, 57, 69, 87, 50, 34, 99, 44, 22, 30, 78, 62, 47, 86, 67, 20, 26, 66}Element(randomList2, Mod[countQuestion, 15] + 1) → randomNum2Shuffle(Sequence[Random[1, 6], n, 1, 100]) → randomList1, {5, 2, 5, 5, 5, 4, 6, 5, 6, 6, 3, 2, 5, 6, 5, 5, 3, 6, 5, 2, 5, 3, 6, 1, 5, 6, 4, 3, 2, 5, 2, 1, 2, 4, 3, 4, 2, 5, 3, 2, 3, 4, 4, 3, 4, 3, 2, 5, 1, 5, 5, 5, 3, 1, 3, 2, 2, 4, 2, 5, 1, 3, 3, 4, 3, 6, 2, 3, 1, 2, 1, 4, 5, 5, 2, 1, 6, 5, 1, 4, 5, 1, 2, 6, 2, 4, 4, 4, 2, 3, 2, 3, 2, 1, 2, 5, 3, 4, 2, 1}Element(randomList1, Mod[countQuestion, 20] + 1) → randomNum1Polygon(Zip[PixelsToPoint[Corner[1], Corner[3], Corner[5], A], A, {(pixelsLeft, pixelsTop), (pixelsLeft, y(Corner[5]) - pixelsBottom), Corner[5] - (pixelsRight, pixelsBottom), (x(Corner[5]) - pixelsRight, pixelsTop)}]) → borderBoxCorner(5) → layoutAppSizeFlatten(Sequence[6 / Random[20, 100], n, 1, 100]) → scatterLinesShuffle(Sequence[Random[20, 30], n, 1, 100]) → randomInts, {22, 23, 29, 27, 24, 26, 29, 23, 29, 22, 30, 22, 25, 23, 22, 21, 24, 23, 28, 25, 20, 22, 23, 20, 21, 24, 21, 25, 21, 20, 22, 26, 29, 20, 26, 20, 21, 25, 27, 25, 23, 22, 25, 30, 30, 28, 23, 22, 23, 24, 20, 23, 26, 29, 22, 22, 21, 29, 23, 29, 26, 22, 20, 25, 22, 20, 25, 28, 20, 26, 24, 22, 23, 23, 30, 27, 22, 21, 27, 22, 29, 30, 30, 27, 22, 30, 23, 26, 20, 21, 29, 20, 22, 20, 26, 21, 23, 20, 20, 23}Segment((0, 0), (graphDims(3), 0)) → axisXSegment((0, 0), (0, graphDims(4))) → axisYShuffle(Sequence[Random[1, 2], n, 1, 100]) → randomOrders, {1, 2, 1, 1, 1, 2, 2, 2, 2, 2, 2, 1, 1, 1, 2, 1, 1, 1, 1, 1, 1, 2, 1, 1, 2, 2, 1, 2, 2, 2, 1, 1, 2, 2, 2, 2, 2, 2, 2, 1, 1, 1, 2, 2, 1, 2, 2, 2, 1, 1, 1, 2, 2, 1, 2, 1, 2, 1, 1, 1, 2, 2, 2, 2, 1, 2, 1, 2, 2, 2, 1, 1, 2, 1, 2, 1, 2, 1, 2, 2, 2, 1, 1, 2, 1, 1, 1, 1, 1, 1, 2, 1, 2, 1, 2, 2, 2, 2, 1, 2}Element(randomOrders, Mod[countQuestion, 100] + 1) → randomOrderDistance(Corner[sizeLabelX, 1], Corner[sizeLabelX, 2]) → numLabelXWDistance(Corner[sizeLabelY, 1], Corner[sizeLabelY, 2]) → numLabelYWJoin({{tableLabel(1) + "&" + (tableLabel(2)) + "\vphantom{\frac{a}{b}}\\\hline"}, Sequence["" + (x(randomPointsRounded(n))) + "&" + (y(randomPointsRounded(n))) + "\vphantom{\large{|}}\\\hline", n, 1, 6]}) → textListForTableSum(textListForTable) → textForTablePolygon(Sequence[Corner[textLabelX, n], n, 1, 4]) → boxAxisXLabelPolygon(Sequence[Corner[textLabelY, n], n, 1, 4]) → boxAxisYLabelPolygon(polygonCoords) → dragAreaCorner(sizingText, 4) → CornerSizingSequence(Corner[textLabelX, n], n, 1, 4) → xLabelCornersSequence(Corner[textLabelY, n], n, 1, 4) → yLabelCornersVerticalText(textLabelY) → vertLabelYVerticalText(textLabelY) → sizeLabelYVertDistance(Corner[sizeLabelYVert, 1], Corner[sizeLabelYVert, 4]) → numVertYHTranslate(PolygonCoordsStart, Vector[(2 * Vector[CornerSizing, PolygonCoordsStart])]) → StartInputPointRemoveUndefined(Sequence[If[boolCorrectPoints(n), answerInputSorted(n)], n, 1, 6]) → correctPointsmakeBox(CornerLeftTable, rowWidth, boxHeight) → hintBoxIf(animationSlider < 0.3, 0, animationSlider - 0.3) → animationSlider1PartitionPoint(HintPoint1, HintPoint3, animationSlider1, 1) → HintAnimate1PartitionPoint(HintPoint2, HintPoint3, animationSlider1, 1) → HintAnimate2Segment(HintPoint2, HintAnimate2 - (0.15, 0)) → hintSeg2Segment(HintPoint1, HintAnimate1 - (0, (2.4 * scalingFactor))) → hintSeg1Translate(hintBox, Vector[(0, ((-numFirstIncorrect) * rowHeight) - titleHeight)]) → hintBoxFirstTranslate(hintBox, Vector[(0, ((-numFirstIncorrect) * rowHeight) - titleHeight)]) → hintBoxOutlineRemove(answerInput, randomPointsRounded) → errorListInputIntersection(answerInput, randomPointsRounded) → solutionListZip(PartitionPoint[n, m, animationSlider2, 1], n, Sort[errorListInput], m, Sort[errorList]) → solutionAnimationSum({tableLabel(1) + "&" + (tableLabel(2)) + "\vphantom{\frac{a}{b}}\\\hline"}) → textForTitleSum({"" + (x(randomPointsRounded(1))) + "&" + (y(randomPointsRounded(1))) + "\vphantom{\large{|}}\\\hline"}) → textForRowexpandCircle(InputPoint1, 7 + (7 * pulsing), Corner[1], Corner[3], Corner[5]) → pulsingObject
AI Drawing Prompt Reference
The graphic consists of a set of randomly generated scatter points whose coordinates are generated from random numbers, deduplicated and sorted. The points are distributed on a coordinate plane, with some marked as special points. A rectangular region is included to indicate the draggable data range, and a border frames the entire scatter area. The overall design is intended for statistics and probability teaching, illustrating random point distribution and data visualization.
The prompt above was compiled from the original drawing commands and is for reference only.