
Geometric Experimental Probability: Polygon Sampling and Theory vs Practice
Loading the math board and drawing, please wait…
In collections
Probability and Statistics
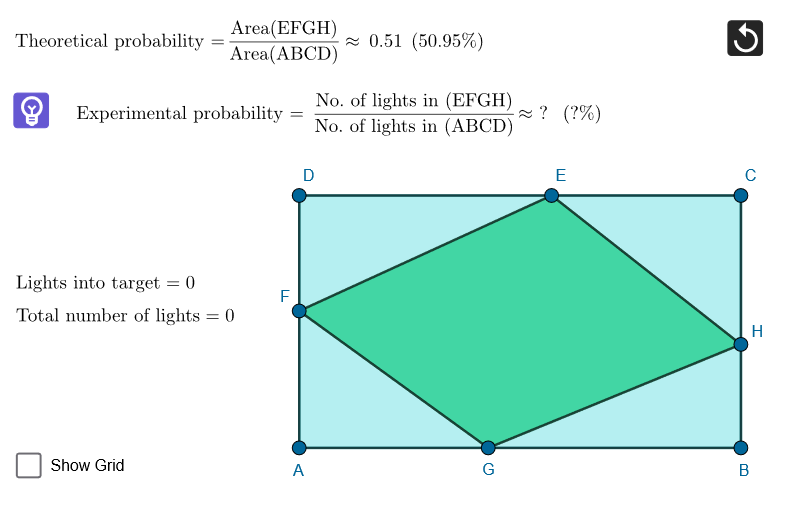
This GeoGebra example demonstrates how theoretical probability can be approximated experimentally by repeatedly sampling random points inside geometric regions and checking how many land in a target set. It connects probability with planar geometry and visualizes the gap and convergence between theoretical probability and empirical estimates. The key mathematical ideas are theoretical vs experimental probability, random experiments, and geometry-based probability via region membership (a point-in-region criterion). Construction-wise, it uses Polygon to build the main polygonal regions (e.g., using points P1–P4 and boundary segments segmAB, segmBC, segmCD, segmDA and others), PointIn to test whether a generated point belongs to the intended region (objects q1, q2 together with points like peep, A–H), Zip to combine/organize point collections into pointsList, and CountIf to count accepted points (pointsIn, countIn). The app updates outputs such as probTheo/currentProb and the corresponding text labels (probTheoText, probText) while button1/button2 control the sampling workflow. Suitable for secondary school through early undergraduate learning, especially for teaching probability & statistics with geometric modeling and computational experiments.
GeoGebra Commands & Parameters
Polygon({P1, P2, P3, P4}) → peepPointIn(peep) → APointIn(peep) → BPointIn(peep) → CPointIn(peep) → DPolygon({A, B, C, D}) → q1Point(Segment[C, D]) → EPoint(Segment[D, A]) → FPoint(Segment[A, B]) → GPoint(Segment[B, C]) → HPolygon({E, F, G, H}) → q2Zip(IsInRegion[A, q2], A, pointsList) → pointsInCountIf(x ≟ true, pointsIn) → countInSegment(A, B) → segmABSegment(B, C) → segmBCSegment(C, D) → segmCDSegment(D, A) → segmDASegment(G, H) → segmGHSegment(H, E) → segmHESegment(E, F) → segmEFSegment(F, G) → segmFG
AI Drawing Prompt Reference
Draw a geometric probability experiment diagram showing three nested quadrilateral regions: an outer quadrilateral as the sampling area, a middle quadrilateral formed by four random interior points, and an inner quadrilateral formed by picking one point on each side of the middle quadrilateral. Random sample points are generated within the outer quadrilateral, and by checking whether each point falls inside the innermost quadrilateral, the experiment demonstrates the comparison and convergence between experimental probability and theoretical probability.
The prompt above was compiled from the original drawing commands and is for reference only.