
Dynamic Boxplot v2.1
Loading the math board and drawing, please wait…
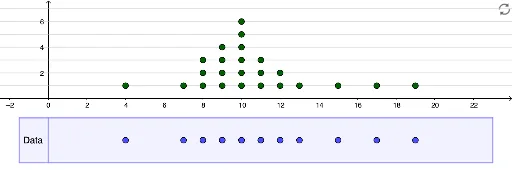
This example demonstrates the construction and interactive manipulation of a dynamic boxplot. It involves core mathematical concepts such as boxplot, data distribution, median, quartiles, and probability & statistics. Key GeoGebra commands used include Sequence, Point, DotPlot, Histogram, Polygon, Intersect, Segment, and BoxPlot for plotting and calculations. Suitable for high school students and math enthusiasts for data visualization teaching and exploration.
GeoGebra Commands & Parameters
Sequence((j, -3.25), j, 1, 22) → L_4Point(L_4) → ZPoint(L_4) → WPoint(L_4) → VPoint(L_4) → UPoint(L_4) → TPoint(L_4) → SPoint(L_4) → RPoint(L_4) → QPoint(L_4) → PPoint(L_4) → OPoint(L_4) → NPoint(L_4) → MPoint(L_4) → LPoint(L_4) → KPoint(L_4) → JPoint(L_4) → IPoint(L_4) → HPoint(L_4) → GPoint(L_4) → FPoint(L_4) → EPoint(L_4) → DPoint(L_4) → APoint(L_4) → BPoint(L_4) → CDotPlot(L_1) → L_2Sequence(-10, 25, 1) → L_5Histogram(L_5, L_1, false) → bSequence(1, 10, 1) → L_3Polygon(A_1, B_1, C_1, D_1) → q1, a_1, b_1, c_1, d_1Intersect(d_1, yAxis) → E_1Intersect(yAxis, b_1) → F_1Segment(E_1, F_1) → fSequence(y = j_1, j_1, 1, 10) → L_6BoxPlot(boxplotoffset, 1, L_1) → a