
Boxplot Construction and Data Analysis
Loading the math board and drawing, please wait…
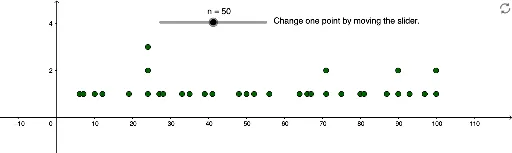
This example demonstrates how to construct boxplots using GeoGebra and analyze data distributions. Key math concepts include probability & statistics on boxplots, central tendency and dispersion, quartiles. Construction involves commands like DotPlot, Histogram, BoxPlot, and objects such as n (data points), A, B (range), L_1 (boxplot elements), a, b (parameters), text1 (text annotations). Suitable for high school and above, ideal for statistics, data analysis introduction, or mathematical modeling projects.
GeoGebra Commands & Parameters
DotPlot(A) → L_1Histogram(B, A, false) → aBoxPlot(5, 0.5, A) → b
AI Drawing Prompt Reference
Create a boxplot to analyze the distribution of a dataset. First, draw a dot plot to show the data points, then create a histogram to observe the frequency distribution of the data, and finally, draw a boxplot based on the data points to display the quartiles and outliers.
The prompt above was compiled from the original drawing commands and is for reference only.