
Dynamic Boxplot v2.0
Loading the math board and drawing, please wait…
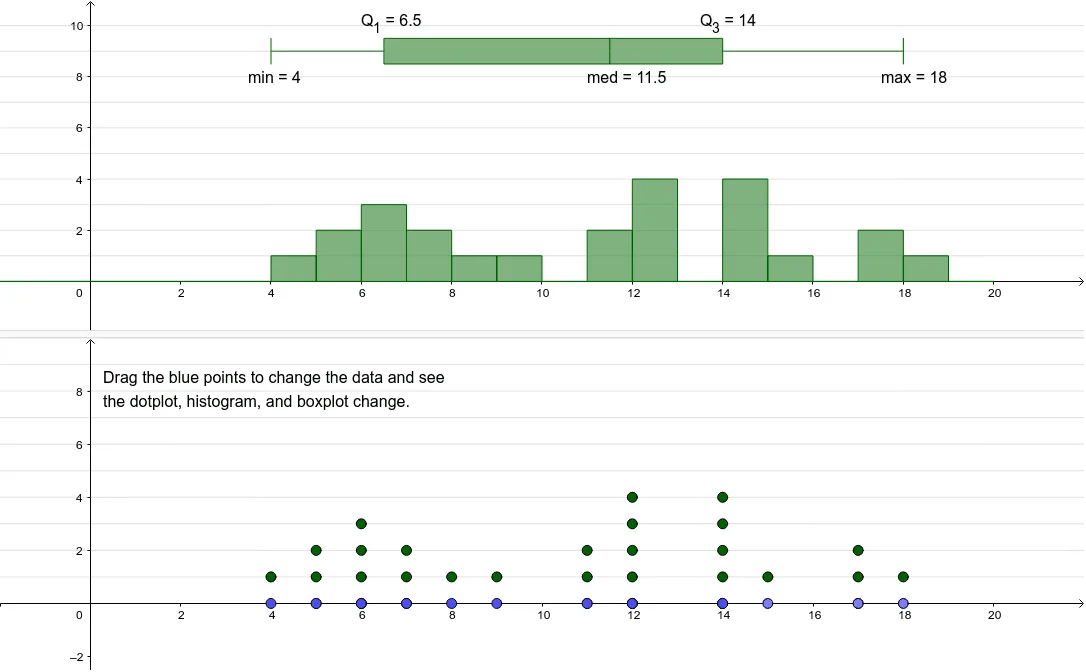
This example demonstrates the construction and dynamic changes of a boxplot. It involves core mathematical concepts such as boxplots, stochastic processes, equations, congruence, spheres, and intersections. The construction utilizes commands and objects like Sequence, Point, DotPlot, Histogram, Line, and BoxPlot in GeoGebra. Suitable for high school and above mathematics teaching, particularly in probability & statistics and data analysis.
GeoGebra Commands & Parameters
Sequence((j, 0), j, n_1, n_2) → L_4Point(L_4) → ZPoint(L_4) → WPoint(L_4) → VPoint(L_4) → UPoint(L_4) → TPoint(L_4) → SPoint(L_4) → RPoint(L_4) → QPoint(L_4) → PPoint(L_4) → OPoint(L_4) → NPoint(L_4) → MPoint(L_4) → LPoint(L_4) → KPoint(L_4) → JPoint(L_4) → IPoint(L_4) → HPoint(L_4) → GPoint(L_4) → FPoint(L_4) → EPoint(L_4) → DPoint(L_4) → APoint(L_4) → BPoint(L_4) → CDotPlot(L_1) → L_2Sequence(-10, 20, 1) → L_5Histogram(L_5, L_1, false) → bSequence(1, 10, 1) → L_3Point(yAxis) → A_1Line(A_1, xAxis) → fBoxPlot(boxplotoffset, 0.5, L_1) → a
AI Drawing Prompt Reference
Create a dynamic boxplot to show data distribution and stochastic changes. Generate a sequence of points, then create a dot plot and histogram based on these points, draw reference lines on the axes, and finally use the data to plot the boxplot, dynamically adjusting its position and size.
The prompt above was compiled from the original drawing commands and is for reference only.