
Best Fit/Scatter Plot For My Video Game Survey
Loading the math board and drawing, please wait…
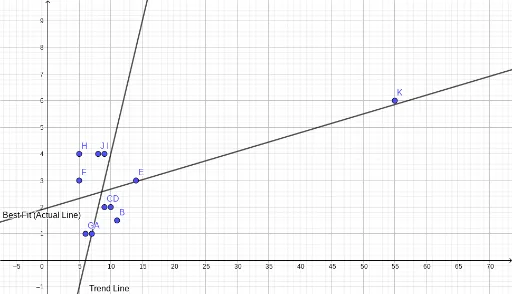
This example demonstrates how to create a scatter plot and best fit line to analyze data from a video game survey using GeoGebra. Key math concepts include scatter plots, linear regression, trend lines, and coordinate geometry. The construction uses the GeoGebra command FitLineY with objects A, B, C, ..., J, K, trendline, g, h, bestfit. Suitable for high school mathematics teaching, focusing on data analysis and linear regression applications.
GeoGebra Commands & Parameters
FitLineY({B, C}) → gFitLineY({E, F}) → hFitLineY({A, B, C, D, E, F, G, H, I, J, K}) → bestfit