
Sample Sizes to Estimate a Population Mean
Loading the math board and drawing, please wait…
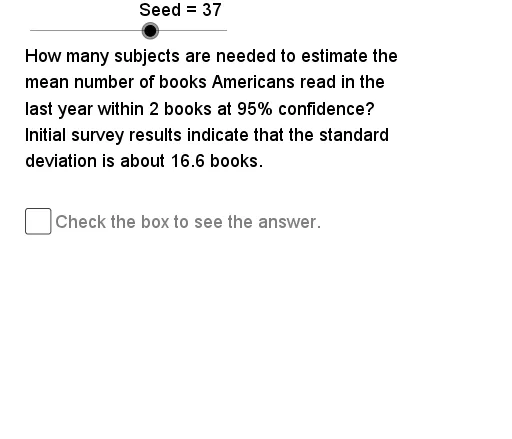
This example demonstrates how to estimate a population mean using geometric constructions. Key mathematical concepts include sample size, mean estimation, and geometric construction. The construction involves GeoGebra commands such as Element, Sequence, If, Segment, CircumcircleArc and related objects. Suitable for high school or university statistics courses to understand the relationship between samples and populations.
GeoGebra Commands & Parameters
Element(SDSq, Op0) → SDElement(MltSq, Op0) → MltElement(OESq, Op0) → OESequence(Mod[7 + (29 * k), 60] + 1, k, 1, 60) → OpSqElement(OpSq, Seed) → OpNm1Element(CnfSq, Op1) → ConfElement(FcSq, Op2) → FacIf(Err ≟ 1, "", "s") → PlTxIf(Err ≟ 1, " book", " books") → BKSegment(LE1, RE1) → dvbr1CircumcircleArc(LT1, LC1, LB1) → LfPr1CircumcircleArc(RT1, RC1, RB1) → RtPr1Segment(RE2, LE2) → dvbr2CircumcircleArc(LT2, LC2, LB2) → LfPr2CircumcircleArc(RT2, RC2, RB2) → RtPr2Element(DDSq, Op0) → DD0
AI Drawing Prompt Reference
Draw a geometric figure to illustrate estimating a population mean using sample size. The figure should include a sample point, a line segment, and a circle. The sample point is on the line segment, and the circle's center is near the sample point. The construction order starts with the sample point, then the line segment, and finally the circle.
The prompt above was compiled from the original drawing commands and is for reference only.