
Representing Complex Points on a Real Line
Loading the math board and drawing, please wait…
In collections
Complex points using iplanes
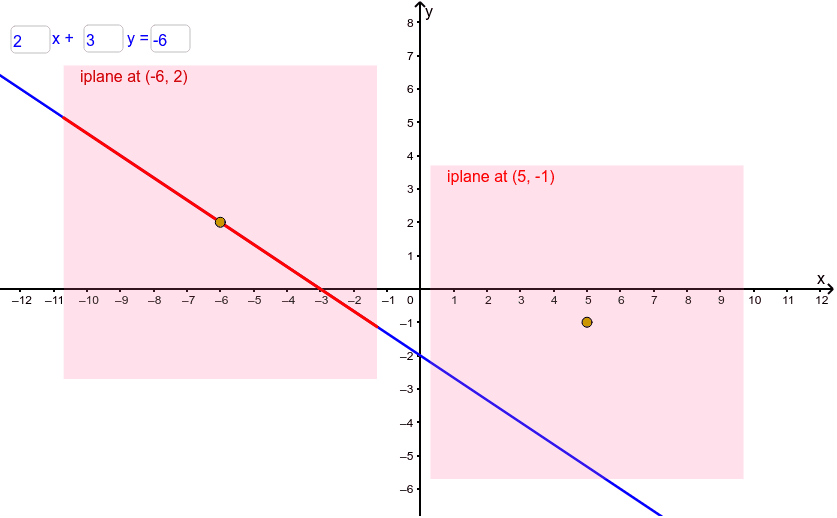
This example demonstrates how to represent complex points on a real line through interactive graphics, visually illustrating the geometric meaning of complex numbers. It involves core mathematical concepts such as complex numbers, real axes, geometric representation, and trigonometric functions. The construction uses commands like Polygon, Textfield, Intersect, and Segment in GeoGebra. Suitable for high school mathematics teaching to help students understand the geometric representation of complex numbers in the complex plane.
GeoGebra Commands & Parameters
Polygon(C + (iplaneslicesize * {(1, 1), (-1, 1), (-1, -1), (1, -1)})) → iplanesliceTextfield(ar) → InputBox1Textfield(br) → InputBox2Textfield(cr) → InputBox3Intersect(g, iplaneslice) → A, BSegment(A, B) → hPolygon(D + (iplaneslicesize * {(1, 1), (-1, 1), (-1, -1), (1, -1)})) → iplaneslice2Intersect(i, iplaneslice2) → E, FSegment(E, F) → j
AI Drawing Prompt Reference
Draw a complex plane with a horizontal real axis and a vertical imaginary axis. Place three interactive input boxes on the real axis to adjust the real parts of three complex parameters. Construct a square region as a visible slice of the plane, centered at a point, and intersect it with a line, marking the two intersection points and connecting them with a segment to show the line's portion inside the slice. Similarly, construct a second square slice at another location, intersect it with another line, and connect the intersection points with a segment. The overall figure illustrates the geometric representation of complex numbers, emphasizing the axes and the intersections of lines with the slices.
The prompt above was compiled from the original drawing commands and is for reference only.