
Interactive Addition and Geometric Construction Demo
Loading the math board and drawing, please wait…
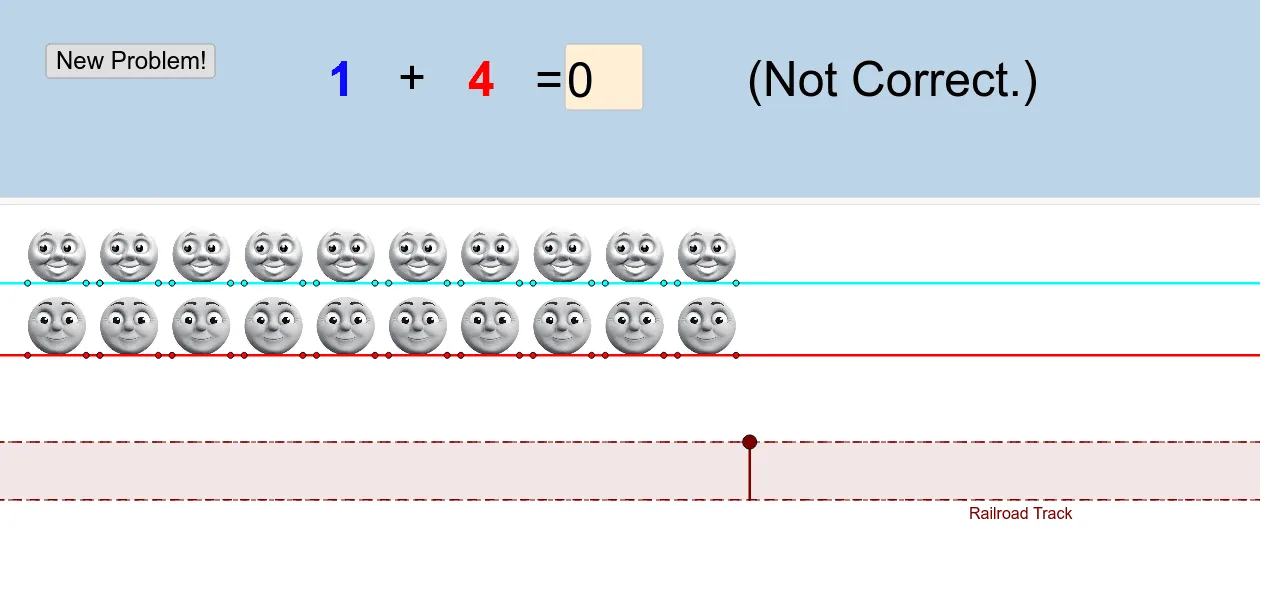
① This GeoGebra example demonstrates the connection between addition operations and geometric figures such as triangles and histograms, while incorporating perimeter, geometric mean, and logarithms. ② Core concepts include addition, triangle perimeter, histogram statistics, geometric mean, and logarithmic functions, with dynamic values generated via random inputs and text fields. ③ Construction highlights: uses Random command for random numbers, Textfield and InputBox for user interaction, Point, OrthogonalLine, Intersect, and Segment to build geometric elements, plus buttons (button1) and checkboxes (rb, rg, bg) for toggling displays; objects include multiple text labels (text1–text14) and images (pic1–pic4), emphasizing dynamic exploration. ④ Suitable for middle/high school math classes or self-study, helping learners grasp the interplay between addition, geometry, statistics, and logarithms, and serving as a teacher demonstration tool for multi-concept connections.
GeoGebra Commands & Parameters
Random(1, 10) → redRandom(1, 6) → opRandom(1, 10) → blueRandom(1, 10) → greenTextfield(rb_1) → InputBox1Textfield(rg_1) → InputBox2Textfield(bg_1) → InputBox3Point(i) → N_2OrthogonalLine(N_2, i) → eIntersect(b, e) → O_2Segment(O_2, N_2) → f
AI Drawing Prompt Reference
Create an interactive math demonstration showing a triangle and a histogram. The triangle is formed by three random points, with one point obtained by intersecting a perpendicular line with another line, and a segment connecting them. Include three input boxes for user-entered values, with checkboxes to toggle red, green, and blue elements. Display multiple text labels showing addition results, triangle perimeter, geometric mean, and logarithms. Add four small decorative images. The layout is dynamic with random numbers, suitable for teaching.
The prompt above was compiled from the original drawing commands and is for reference only.