
Complex Roots and Quadratic Graphs
Loading the math board and drawing, please wait…
In collections
Modeling with Complex Numbers
Modeling with Complex Numbers
Modeling with Complex Numbers
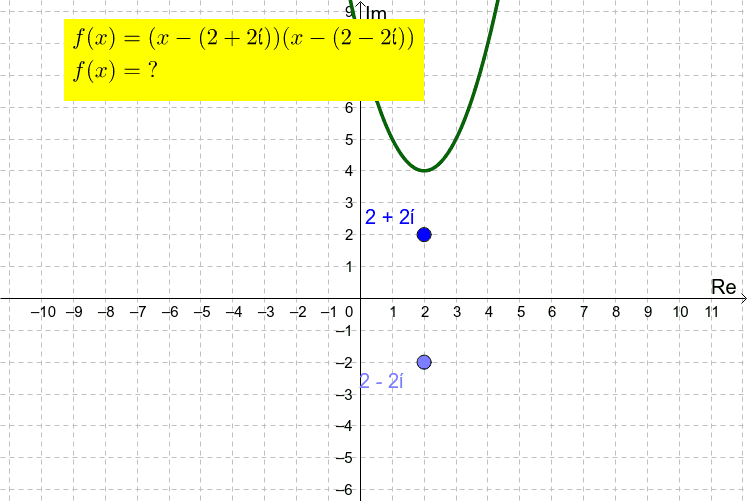
This example demonstrates how the graph of a quadratic function changes as you drag the BLUE point (one of the complex conjugate roots). It involves core math concepts like complex numbers, quadratic functions, and the relationship between roots and graphs. Constructed using GeoGebra commands like Mirror, Point, Locus, and LaTeX with objects A, B, E, B', C, z_1, D, loc1, text2, text1. Suitable for high school mathematics education to understand the connection between complex roots and function graphs.
GeoGebra Commands & Parameters
Mirror(A, xAxis) → EMirror(B, xAxis) → B'Point(xAxis) → CLocus(D, C) → loc1LaTeX($1) → text2
AI Drawing Prompt Reference
Draw the graph of a quadratic function and show the relationship with its complex roots. Include a draggable blue point representing one of the complex roots, and observe how the function graph changes as the point is moved. Reflect this point across the x-axis and draw the locus connecting the reflected point to a point on the x-axis. Label the complex roots and demonstrate how the graph changes with variations in the roots.
The prompt above was compiled from the original drawing commands and is for reference only.