
Double Source Wave Interference
Loading the math board and drawing, please wait…
In collections
Patterns & Equations
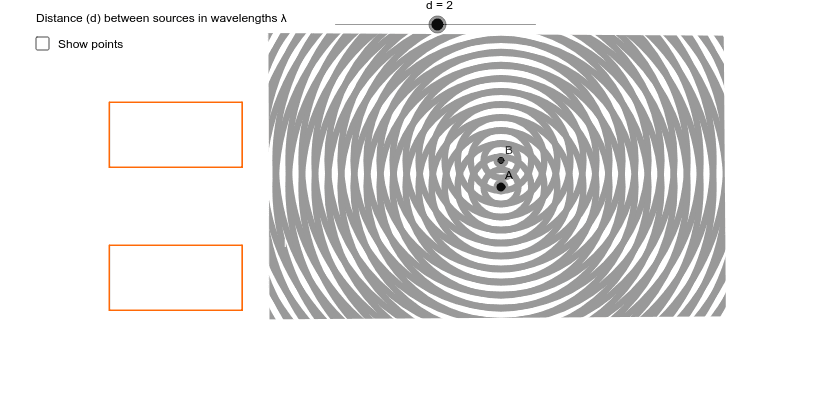
This example demonstrates the interference pattern of wave fronts generated by two point sources, with an adjustable distance between the sources to observe how the pattern changes. Core mathematical concepts include the superposition principle, conditions for constructive and destructive interference, path difference and phase difference, and the hyperbolic geometry of interference fringes. Construction highlights: using GeoGebra commands such as Segment, Polygon, and Point to build the geometric framework, defining variables d (source separation) and t (time), computing distances via objects like SA, SB, AP, BP, and using sliders to control parameters. Displacement-time graphs are also displayed to show the temporal behavior of the waves. This is suitable for high school or introductory university physics courses on wave optics, as well as for mathematics classes exploring hyperbolas and geometric loci, providing an interactive way to understand interference conditions.
GeoGebra Commands & Parameters
Segment(SA, P) → APSegment(SB, P) → BPSegment(SA, Q) → AQSegment(SB, Q) → BQPolygon(A, B, C, D) → poly1, a, b, c, d_1Polygon(F, G, H, I) → poly2, f, g, h, iPoint(h) → KPolygon(J, D, K, E) → poly3, j, d_2, k, ePoint(c) → MPolygon(C, I, L, M) → poly4, c_1, i_1, l, mPolygon(D1, D2, D3, D4) → poly5, d1, d2, d3, d4Polygon(E1, E2, E3, E4) → poly6, e1, e2, e3, e4
AI Drawing Prompt Reference
Draw a geometric diagram of double-source wave interference. Two point sources are placed on a horizontal line with adjustable separation. From each source, draw line segments to a common point to represent path differences. Include several polygonal regions formed by these segments, illustrating the interference fringe pattern. Mark a point on one edge for reference. Also show displacement-time graphs to depict the temporal wave behavior, creating an interactive visualization of constructive and destructive interference.
The prompt above was compiled from the original drawing commands and is for reference only.