
Introduction to Simple Linear Regression: Visualizing Error Sum of Squares
Loading the math board and drawing, please wait…
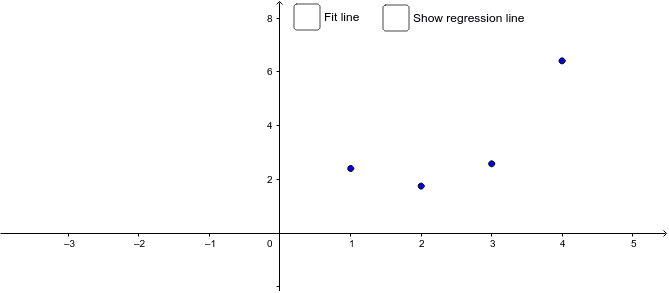
① This example demonstrates simple linear regression using four scatter points and an adjustable fitted line, showing how changing the slope and intercept affects the sum of squared errors. ② Core mathematical concepts include linear regression, least squares method, residuals (errors), and correlation coefficient, providing a foundation for statistical data fitting. ③ Construction details: GeoGebra commands Segment and FitLineY are used; objects include points A, B, C, D, line m, sliders for intercept (c) and slope (m), error segments e_1 to e_4, and displayed values for sum of squares (SS), correlation coefficient (r), and regression equation text. ④ Suitable for high school or introductory college statistics students, this interactive tool helps learners grasp the geometric meaning of regression lines and the least squares principle, and serves as an effective classroom demonstration for exploring how parameter adjustments influence model fit.
GeoGebra Commands & Parameters
Segment(A, (1, a(1))) → e_1Segment(B, (2, a(2))) → e_2Segment(C, (3, a(3))) → e_3Segment(D, (4, a(4))) → e_4FitLineY({A, B, C, D}) → r
AI Drawing Prompt Reference
Draw a scatter plot with four points A, B, C, and D, and a line m that can be adjusted for slope and intercept. Show the vertical distance line segments e1 to e4 from each point to the line, and the sum of squares SS of these segments. Also display the correlation coefficient r and the regression equation.
The prompt above was compiled from the original drawing commands and is for reference only.