
Randomized Bike Speed Comparison Word Problem
Loading the math board and drawing, please wait…
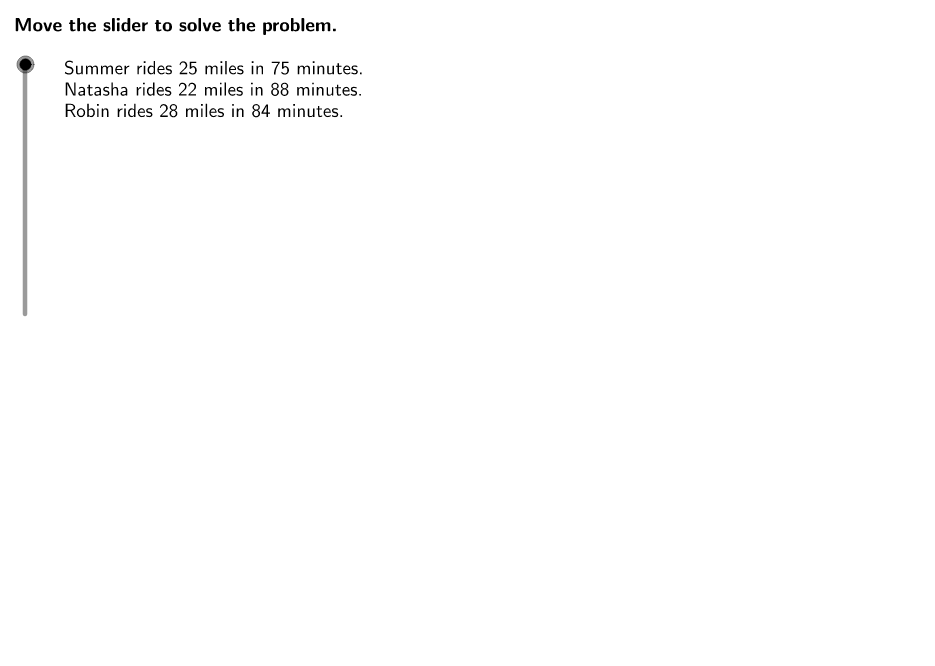
This GeoGebra example presents a word problem about three friends riding bikes, with distances and times given (Summer: 25 miles in 75 min, Natasha: 22 miles in 88 min, Robin: 28 miles in ...). It demonstrates how to create a randomized practice problem where data changes each time, and the app automatically computes and compares speeds. Core math concepts include ratio, speed (distance/time), unit conversion, and comparison. The construction uses LaTeX for formulas, TableText for data tables, a stepper slider to control steps, a button to trigger randomization, and numerous text objects (SummerDist, SummerTime, etc.) to store and display dynamic values. Suitable for middle school students learning proportional reasoning or for teachers generating varied practice problems.
GeoGebra Commands & Parameters
LaTeX(steps) → counterLaTeX("\text{Use the buttons below to return to the original problem or}\cr\text{randomly generate a similar practice problem.}") → RandomizationTextCorner(1) → ACorner(3) → BLaTeX("\text{Determine the unit rate for each rider.}") → text1LaTeX((((((((("\text{Summer rides " * SummerDist) * " miles in ") * SummerTime) * " minutes, or }\textcolor{#000099}{\frac{") * SummerTime) * "\text{ minutes}}{") * SummerDist) * "\text{ miles}}}.")) → text4LaTeX((((((((((((("\text{Summer rides " * SummerDist) * " miles in ") * SummerTime) * " minutes.}\cr\text{Natasha rides ") * NatashaDist) * " miles in ") * NatashaTime) * " minutes.}\cr\text{Robin rides ") * RobinDist) * " miles in ") * RobinTime) * " minutes.}")) → ProblemLaTeX((((((((("\text{Natasha rides " * NatashaDist) * " miles in ") * NatashaTime) * " minutes, or }\textcolor{#000099}{\frac{") * NatashaTime) * "\text{ minutes}}{") * NatashaDist) * "\text{ miles}}}.")) → text6LaTeX((((((((("\text{Robin rides " * RobinDist) * " miles in ") * RobinTime) * " minutes, or }\textcolor{#000099}{\frac{") * RobinTime) * "\text{ minutes}}{") * RobinDist) * "\text{ miles}}}.")) → text8LaTeX((((((("\text{Summer's rate is " * SummerRtime) * " minutes per mile.} \cr\text{Natasha's rate is ") * NatashaRtime) * " minutes per mile.} \cr\text{Robin's rate is ") * RobinRtime) * " minutes per mile.}")) → text10aLaTeX((("\text{" * conclusions) * "}")) → text11LaTeX("\text{Use the unit rates to state two conclusions that can be made about the rates each person rides.}") → text10LaTeX("\text{First set up a ratio for each rider. }\cr\text{Then determine the unit rate by reducing the fraction.}") → text2TableText({{LaTeX[(((("\textcolor{#000099}{\frac{" * SummerTime) * "\text{ minutes}}{") * SummerDist) * "\text{ miles}}}")], LaTeX["\text{Summer's rate}"]}, {LaTeX[(((("\textcolor{#000099}{=\frac{" * SummerRtime) * "\text{ minutes}}{") * SummerRdist) * "\text{ mile}}}")], LaTeX["\text{Reduce the fraction.}"]}}, "l") → text5TableText({{LaTeX[(((("\textcolor{#000099}{\frac{" * NatashaTime) * "\text{ minutes}}{") * NatashaDist) * "\text{ miles}}}")], LaTeX["\text{Natasha's rate}"]}, {LaTeX[(((("\textcolor{#000099}{=\frac{" * NatashaRtime) * "\text{ minutes}}{") * NatashaRdist) * "\text{ mile}}}")], LaTeX["\text{Reduce the fraction.}"]}}, "l") → text7TableText({{LaTeX[(((("\textcolor{#000099}{\frac{" * RobinTime) * "\text{ minutes}}{") * RobinDist) * "\text{ miles}}}")], LaTeX["\text{Robin's rate}"]}, {LaTeX[(((("\textcolor{#000099}{=\frac{" * RobinRtime) * "\text{ minutes}}{") * RobinRdist) * "\text{ mile}}}")], LaTeX["\text{Reduce the fraction.}"]}}, "l") → text9LaTeX("\text{Move the slider to solve the problem.}") → text0LaTeX("\text{The ratio compares the number of minutes per mile or, written as a fraction, }\textcolor{#000099}{\frac{\text{minutes}}{\text{miles}}}.") → text3
AI Drawing Prompt Reference
Create a math practice interface for a randomized word problem comparing bike speeds of three friends. The interface features instructional text at the top explaining the task. Below, three sections for Summer, Natasha, and Robin display their distance and time in text boxes, such as Summer riding 25 miles in 75 minutes. A table follows with rows for each rider, showing the original rate as a fraction and the reduced unit rate. At the bottom, conclusions based on the rates are displayed. The interface includes a slider to control steps and a button to randomize data. The layout should be clear and organized for educational use.
The prompt above was compiled from the original drawing commands and is for reference only.