
PV and TS Diagrams
Loading the math board and drawing, please wait…
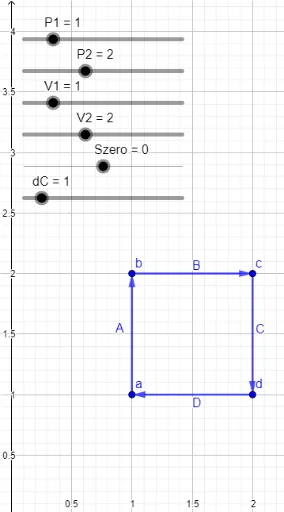
This example demonstrates PV and TS diagrams in thermodynamics. Key mathematical concepts include curve drawing, vectors, and temperature-volume relationships. Using GeoGebra commands like Vector and CurveCartesian, it dynamically shows different processes in pressure-volume and temperature-entropy relationships. Suitable for high school physics and thermodynamics courses.
GeoGebra Commands & Parameters
Vector(a, b) → AVector(b, c) → BVector(c, d) → CVector(d, a) → DCurveCartesian((s + Szero, (Ta * ℯ^(s / Cv))), s, 0, dSApath) → TSApathCurveCartesian((s + Szero + dSApath, (Tb * ℯ^(s / (Cp)))), s, 0, dSBpath) → TSBpathCurveCartesian(((-s) + Szero + dSApath + dSBpath, (Tc * ℯ^(((-s)) / Cv))), s, 0, (-dSCpath)) → TSCpathCurveCartesian(((-s) + Szero + dSApath + dSBpath + dSCpath, (Td * ℯ^(((-s)) / (Cp)))), s, 0, (-dSDpath)) → TSDpath