
Total Differential Visualization (Boas Ch 4, Fig 3.2)
Loading the math board and drawing, please wait…
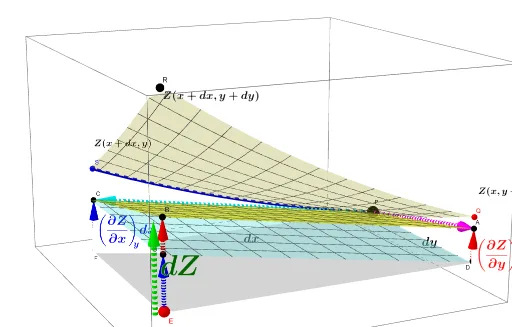
This GeoGebra example visualizes the total differential of a two-variable function on a 3D surface with tangent planes, corresponding to Boas Chapter 4, Figure 3.2. It demonstrates how small changes dx and dy lead to an approximate change dz via partial derivatives, illustrating the linear approximation concept. Core mathematical concepts include partial derivatives, total differential, tangent plane approximation, and differential increments. The construction uses GeoGebra commands such as Derivative for computing partial derivatives, PointIn and Vector for sampling points and increment vectors, CurveCartesian for partial derivative curves, and Surface for the function graph. Key objects include Z, P, zp, dZdx, dZdy, dZdxP, dZdyP, E, R, nudge, Zsample, PGCDplane, Hplane, PABCplane, dy, dx, F, D, C, G, A, B, S, Q, along with multiple text labels explaining each quantity. Suitable for university-level calculus or multivariable function courses, this helps students grasp the geometric meaning of the total differential as a linear approximation and the role of partial derivatives in constructing tangent planes.
GeoGebra Commands & Parameters
Derivative(Z, x) → dZdxDerivative(Z, y) → dZdyPointIn(zp) → EVector(F, C) → dZdxdxFVector(E, E + dZdxdxF) → dZdxdxEVector(D, A) → dZdydyDVector(G, B) → dZdydyECurveCartesian(P + (t, 0, Z(x(P) + t, y(P)) - Z(x(P), y(P))), t, 0, dx) → dZdxCurveCurveCartesian(P + (0, t, Z(x(P), y(P) + t) - Z(x(P), y(P))), t, 0, dy) → dZdyCurveVector(E + nudgePE, B + nudgePE) → dZVector(P, C) → uVector(P, A) → vSurface(i + x(P), y(P), k, i, 0, (2 * dx), k, 0, z(R - E)) → constYSurface(x(P), i + y(P), k, i, 0, (2 * dy), k, 0, z(R - E)) → constX
AI Drawing Prompt Reference
Draw a 3D surface representing a two-variable function. Select a point on the surface and construct the tangent plane at that point. Show the partial derivative curves along the x and y directions. From the point, draw vectors representing the increments dx and dy, and the resulting change dz, illustrating the total differential as a linear approximation. Also draw two cross-sections parallel to the coordinate planes through the point, and a parallelogram formed by the increment vectors. Label all vectors and increments to clarify the geometric meaning of partial derivatives and the total differential.
The prompt above was compiled from the original drawing commands and is for reference only.