
Exploration: Graphing Velocity
Loading the math board and drawing, please wait…
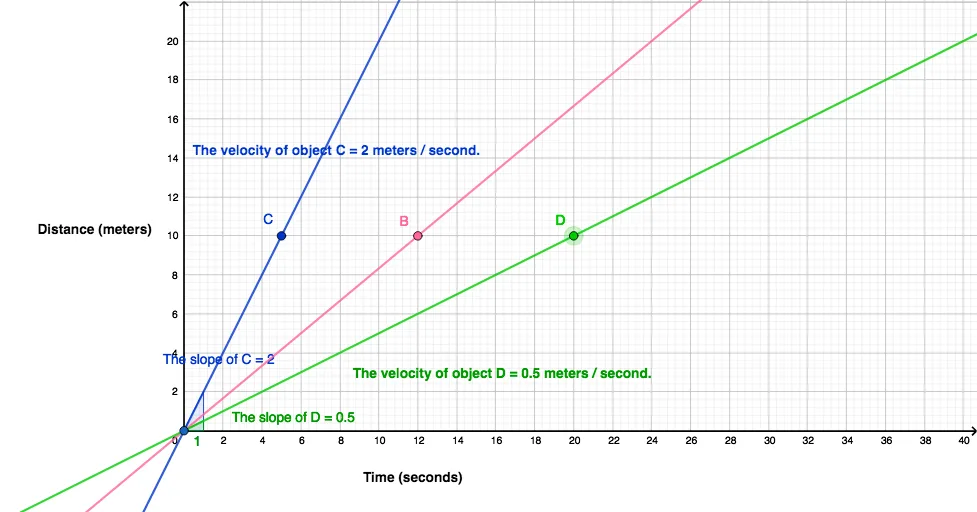
This example demonstrates how to graph velocity using GeoGebra, analyzing its relationship with displacement and acceleration. Core math concepts include velocity, slope, function graphs, and coordinate geometry. Construction highlights involve commands like Point, Line, and Slope. Suitable for high school students learning calculus and kinematics to understand the physical meaning and mathematical expression of velocity-time graphs.
GeoGebra Commands & Parameters
Point(yAxis) → ALine(A, B) → fLine(A, C) → gLine(A, D) → hSlope(g) → mSlope(h) → m_1Slope(g_1) → m_2
AI Drawing Prompt Reference
Draw a coordinate system with a point on the y-axis. Through this point, draw two lines parallel to the x-axis and another x-axis. Calculate the slopes of these two lines and represent them as new lines. Finally, show the relationship between these lines and slopes to analyze the relationship among velocity, displacement, and acceleration.
The prompt above was compiled from the original drawing commands and is for reference only.