
Derivative of Position Vector and Gradient Visualization
Loading the math board and drawing, please wait…
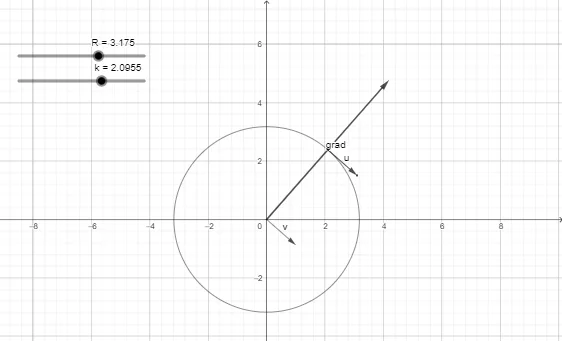
This GeoGebra example demonstrates how to dynamically visualize the derivative of a position vector and the gradient concept. It shows the relationship between position vectors and their time derivatives through parametric curves, helping users understand the geometric meaning of vector differentiation. The construction uses Vector command with objects like R, eq1, k, v, A, B, u, c, and grad to illustrate gradient computation. Ideal for college-level calculus and vector analysis students, as well as mathematics teachers demonstrating concepts in differential geometry or multivariate calculus courses.
GeoGebra Commands & Parameters
Vector((1, ((-k)) / sqrt(R^(2) - k^(2)))) → vVector(A, B) → uVector(((2 * k), (2 * sqrt(R^(2) - k^(2))))) → grad
AI Drawing Prompt Reference
Create a dynamic graph showing the relationship between a position vector and its time derivative. First, draw a vector v with the coordinates (1, ((-k)) / sqrt(R^(2) - k^(2))). Then, draw a vector u from point A to point B. Finally, draw a vector grad with coordinates ((2 * k), (2 * sqrt(R^(2) - k^(2)))), representing the gradient. Observe how these vectors change dynamically to understand the concept of vector derivatives and gradients.
The prompt above was compiled from the original drawing commands and is for reference only.