
Profit & Loss Practice: Interactive Cost, Price & Profit Demo
Loading the math board and drawing, please wait…
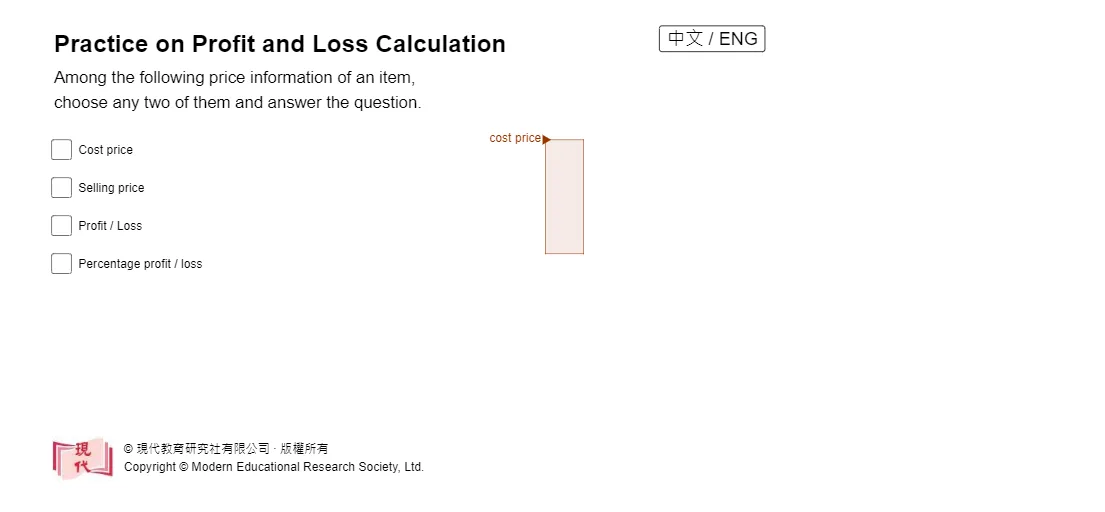
① This example demonstrates an interactive slider‑driven visualization of the quantitative relationship among cost price, selling price, and profit or loss, using polygons and vectors to illustrate the profit/loss region. ② Core mathematical concepts include percentage calculations, the profit/loss formulas (profit = selling price − cost price, loss = cost price − selling price), basic arithmetic operations, and functional dependence between variables. ③ Construction highlights: Random generates random prices; Intersect and Polygon build the profit/loss polygon; Vector draws the price‑difference vector; If statements switch display based on price comparison; Segment marks key segments. Main objects are CostPrice, SellingPrice, ProfitLoss, points A, B, C, D, and associated text labels. ④ Suitable for middle‑school (grades 7‑9) mathematics units on percentage applications, and also as a supplemental resource for high‑school business mathematics or financial literacy introductions, supporting both teacher demonstrations and student inquiry.
GeoGebra Commands & Parameters
Random(1, 100) → bIntersect(xAxis, yAxis) → APolygon(A, B, C, D) → q1, a_1, b_1, c, dVector(F, E) → uPolygon(C, D, E, G) → q2, c_1, d_1, e, gPolygon(C, D, E, G) → q3, c_2, d_2, e_1, g_1If(f, 1, 0) → f_{1}If(h, 1, 0) → h_{1}If(i, 1, 0) → i_{1}If(j, 1, 0) → j_{1}Segment(A, E) → l
AI Drawing Prompt Reference
Create an interactive visualization where sliders control the cost price and selling price, showing the resulting profit or loss. Draw polygons and vectors to illustrate the profit/loss region, using random price values and intersection points. Include labeled points for cost price, selling price, and profit/loss, as well as a segment marking the price difference. Use a vector to display the difference between selling and cost prices. The diagram should be suitable for middle‑school lessons on percentages and basic business math, helping students explore how changes in price affect profit or loss.
The prompt above was compiled from the original drawing commands and is for reference only.