
Frequency Distribution Table Construction Tool
Loading the math board and drawing, please wait…
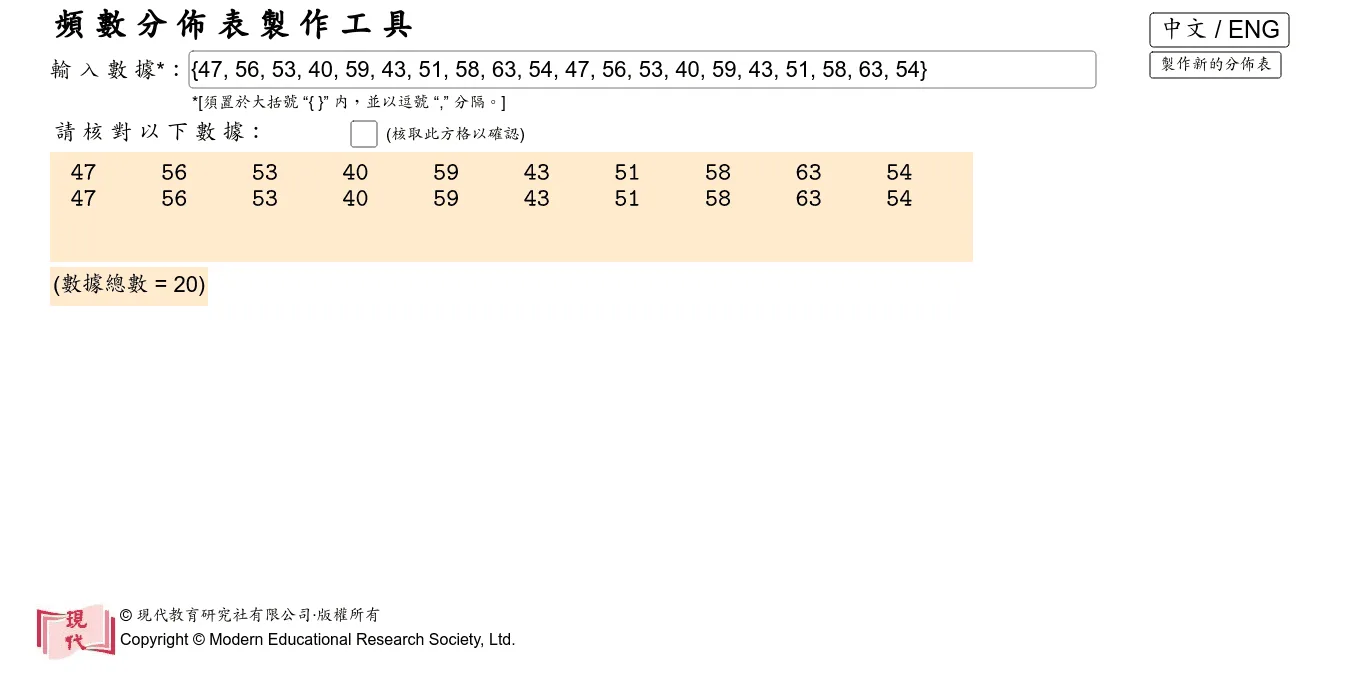
① This example demonstrates how to automatically build a frequency distribution table in GeoGebra, visualizing data grouping and frequency counting. ② Core mathematical concepts include frequency distribution, class interval definition, frequency calculation, and data summarization. ③ Construction highlights: commands Max, Min, Sequence, Unique, CountIf, Frequency, Sum, Length, If, Append, TableText, Textfield, RotateText, Segment are employed together with objects chi, NumClasses, ClassLimit1, Data, q, ClassWidth, A2‑A13, t, C2‑C12, H2‑H12 to create dynamic grouping and table output. ④ Suitable for high‑school statistics courses, introductory university probability and statistics, and data‑analysis demonstrations, serving as an interactive teaching aid or student exploration tool.
GeoGebra Commands & Parameters
Max(Data) → qIf(ClassWidth > 1, 1, If[ClassWidth > 0.1, 0.1, 0.01]) → tCountIf(A2 ≤ x ≤ C2, Data) → H2CountIf(A3 ≤ x ≤ C3, Data) → H3CountIf(A4 ≤ x ≤ C4, Data) → H4CountIf(A5 ≤ x ≤ C5, Data) → H5CountIf(A6 ≤ x ≤ C6, Data) → H6CountIf(A7 ≤ x ≤ C7, Data) → H7CountIf(A8 ≤ x ≤ C8, Data) → H8CountIf(A9 ≤ x ≤ C9, Data) → H9CountIf(A10 ≤ x ≤ C10, Data) → H10CountIf(A11 ≤ x ≤ C11, Data) → H11CountIf(A12 ≤ x ≤ C12, Data) → H12CountIf(A13 ≤ x ≤ C13, Data) → H13Length(Data) → NumDataMin(Data) → pSequence(ClassLimit1 - t / 2 + (((2 * i) - 1) * ClassWidth / 2), i, 1, NumClasses, 1) → ClassMarkSequence((i - 8.15 - (0.15 * ceil(lg(Element[ClassMark, (i - 1) / 2] + 1) - 1)), -4.6), i, 3, 2 + (2 * NumClasses) - 1, 2) → XpointRotateText("Frequency", 90°) → text17Textfield(Data) → InputBox2Textfield(ClassLimit1) → InputBox3Sequence(If[NumData ≥ i, Element[Data, i], x], i, 1, If[NumData ≥ 10, 10, NumData], 1) → DataRow1Sequence(If[NumData ≥ i, Element[Data, i], x], i, 11, If[NumData ≥ 20, 20, NumData], 1) → DataRow2Sequence(If[NumData ≥ i, Element[Data, i], 32], i, 21, If[NumData ≥ 30, 30, NumData], 1) → DataRow3Sequence(If[NumData ≥ i, Element[Data, i], x], i, 31, If[NumData ≥ 40, 40, NumData], 1) → DataRow4Sequence(If[NumData ≥ i, Element[Data, i], x], i, 51, If[NumData ≥ 60, 60, NumData], 1) → DataRow6Sequence(If[NumData ≥ i, Element[Data, i], x], i, 41, If[NumData ≥ 50, 50, NumData], 1) → DataRow5If(chi ≟ true, {"組別", "組界", "組中點", "頻數"}, {"Group", "Class boundaries", "Class mark", "Frequency"}) → ColumnHeadsAppend(Element[ColumnHeads, 1], Sequence[Element[Classes, i], i, 1, NumClasses, 1]) → TableList1Append(Element[ColumnHeads, 2], Sequence[Element[Boundaries, i], i, 1, NumClasses, 1]) → TableList2Append(Element[ColumnHeads, 3], Sequence[Element[ClassMarks, i], i, 1, NumClasses, 1]) → TableList3Append(Element[ColumnHeads, 4], Sequence[Element[Frequencies, i], i, 1, NumClasses, 1]) → TableList4Segment((-7.2, -3.6), (-7, -4.4)) → hSegment((-7.4, -4), (-7.2, -3.6)) → gSegment((-8.2, -4), (-7.4, -4)) → fSegment((-6.8, -4), (-5 + (2 * NumClasses), -4)) → XaxisSegment((-7, -4.4), (-6.8, -4)) → iSequence(Segment[(i - 8, -4), (i - 8, -4.2)], i, 3, 2 + (2 * NumClasses) - 1, 2) → TicksVert3TableText({TableList1, TableList4}, "vc|_") → text22TableText({DataRow1, DataRow2, DataRow3, DataRow4, DataRow5, DataRow6, "."}) → text21Unique(Data) → ItemsIf(chi ≟ true, {"-- 請選擇 --", "分組", "不分組"}, {"-- please select --", "in groups", "without grouping"}) → OptionLength(Items) → NumItemsSum(Data) → cSum(DataFloor) → dIf(c ≠ d, Max[0.1, floor(((q - ClassLimit1) / NumClasses * 10)) / 10], ceil((q - ClassLimit1 + 1) / NumClasses)) → rIf(c ≠ d, Max[0.1, (q - ClassLimit1) / (NumClasses - 1)], Max[r + 1, ceil((q - ClassLimit1) / (NumClasses - 1))]) → sFrequency(Data) → FreqItemsAppend(If[chi ≟ true, "項目", "Item"], Sequence[Element[Items, i], i, 1, NumItems, 1]) → TableListItemsAppend(If[chi ≟ true, "頻數", "Frequency"], Sequence[Element[FreqItems, i], i, 1, NumItems, 1]) → TableListFreqItemsTableText({TableListItems, TableListFreqItems}, "vc|_") → text3
AI Drawing Prompt Reference
Build an interactive frequency distribution table that lets the user enter raw data, choose a starting class limit and number of classes, then automatically computes the maximum, minimum, class width, class marks and frequencies for each class, displaying the grouped table, the original data rows, and a labeled axis with ticks, with a language toggle optionally for English and Chinese.
The prompt above was compiled from the original drawing commands and is for reference only.