
Rectangular Coordinate System Drawing Tool (1)
Loading the math board and drawing, please wait…
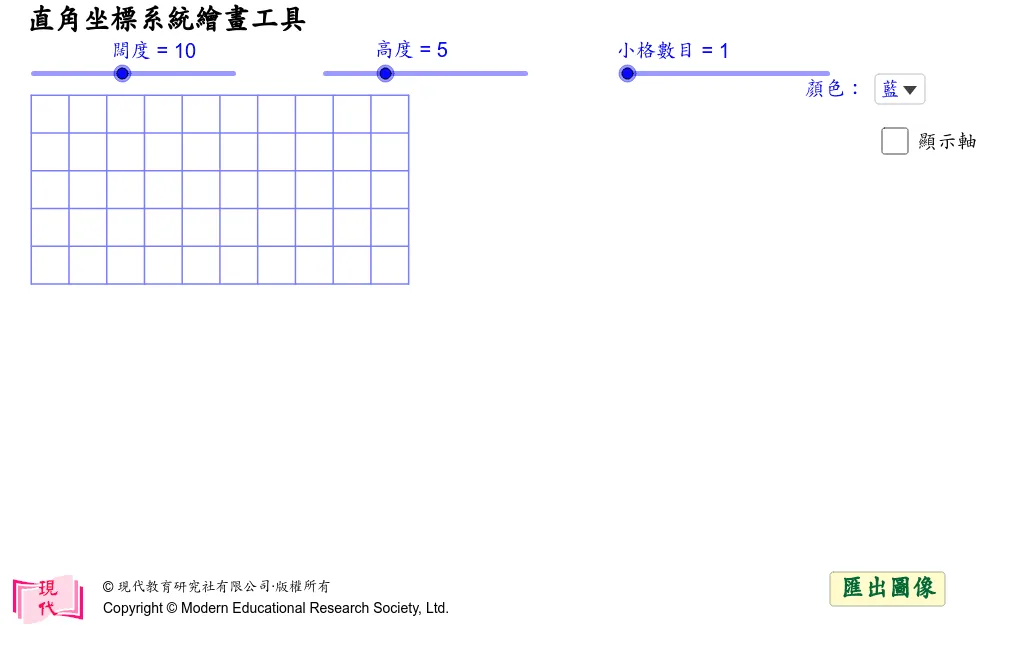
This example presents an interactive rectangular coordinate system drawing tool that creates axes, grid lines, and tick marks dynamically, allowing users to plot points and display vectors. It illustrates core concepts of coordinate geometry such as axes, scales, intersections, and point labeling. The construction uses Sequence to generate tick marks, DynamicCoordinates for real‑time point tracking, Vector for axis arrows, If for conditional element visibility, and Text for coordinate labels. Designed for middle‑school to high‑school students, it supports lessons on coordinate geometry, function graphing, and visual calculus.
GeoGebra Commands & Parameters
Sequence(Segment[(width, (-i)), (0, (-i))], i, 0, height) → HL0Sequence(Segment[(i, (-height)), (i, 0)], i, 0, width) → VL0Sequence(Sequence[Segment[(i + (j * 1 / div), (-height)), (i + (j * 1 / div), 0)], j, 1, div - 1], i, 0, width - 1) → VL1Sequence(Sequence[Segment[(width, (-i) - (j * 1 / div)), (0, (-i) - (j * 1 / div), 0)], j, 1, div - 1], i, 0, height - 1) → VL2Sequence((i, 0.5), i, 1, width - 1) → xlistSequence((width + 0.5, (-i)), i, 1, height - 1) → ylistDynamicCoordinates(XX, x(ClosestPoint[xlist, XX]), 0.5) → XDynamicCoordinates(YY, width + 0.5, y(ClosestPoint[ylist, YY])) → YSequence(Segment[(i, y(Y)), (i, y(Y) - 0.2)], i, 1, width - 1) → xmarkSequence(Segment[(x(X), (-i)), (x(X) - 0.2, (-i))], i, 1, height - 1) → ymarkSequence(i - x(X), i, 1, width - 1) → xlabSequence(i - height - y(Y), i, 1, height - 1) → ylabSequence(If[xlab(i) ≤ -10, Element[xd, 3], If[xlab(i) < 0 ∨ xlab(i) ≥ 10, Element[xd, 2], Element[xd, 1]]], i, 1, width - 1) → xdlistSequence(If[xlab(i) ≤ -10, Element[xd, 3], If[xlab(i) < 0 ∨ xlab(i) ≥ 10, Element[xd, 2], Element[xd, 1]]], i, 1, width - 1) → l1Sequence(If[ylab(i) ≤ -10, Element[yd, 3], If[ylab(i) < 0 ∨ ylab(i) ≥ 10, Element[yd, 2], Element[yd, 1]]], i, 1, height - 1) → ydlistSequence(Text[xlab(i), (i - xdlist(i), y(Y) - 0.6), true], i, x(X) + 1, width - 1) → pxlabelSequence(Text[xlab(i), (i - xdlist(i), y(Y) - 0.6), true], i, 1, x(X) - 1) → nxlabelSequence(Text[ylab(height - i), (x(X) - ydlist(height - i), (-i) - 0.12), true], i, 1, (-y(Y)) - 1) → pylabelSequence(Text[ylab(i), (x(X) - ydlist(i), (-height) + i - 0.12), true], i, 1, height + y(Y) - 1) → nylabelVector((0, y(Y)), (width - 0.25, y(Y))) → xaxisVector((x(X), (-height)), (x(X), -0.25)) → yaxisIf(width > 2 ∧ height > 2, x(X) - 0.3, If[width > 2, x(X) - xd(1), x(X) - yd(1)]) → zxIf(width > 2 ∧ height > 2, y(Y) - 0.4, If[width > 2, y(Y) - 0.6, y(Y) - 0.12]) → zyText(0, (zx, zy)) → zeroText("直角坐標系統繪畫工具") → text1
AI Drawing Prompt Reference
Draw an interactive rectangular coordinate system. Include horizontal and vertical axes with arrowheads, and automatically generate tick marks along both axes with visible coordinate labels near the ticks. Create a full grid look by constructing evenly spaced vertical and horizontal line segments across the viewing area. Add a draggable reference point whose real-time coordinates snap to the nearest grid/tick positions, and at that snapped location draw small auxiliary marks showing the x and y positions. Display coordinate text for the selected point relative to the axes, and place a “0” label near the origin. Maintain labels on the x- and y-axes so the coordinate geometry is clear for plotting points and vectors.
The prompt above was compiled from the original drawing commands and is for reference only.