
Rectangular Coordinate System Drawing Tool
Loading the math board and drawing, please wait…
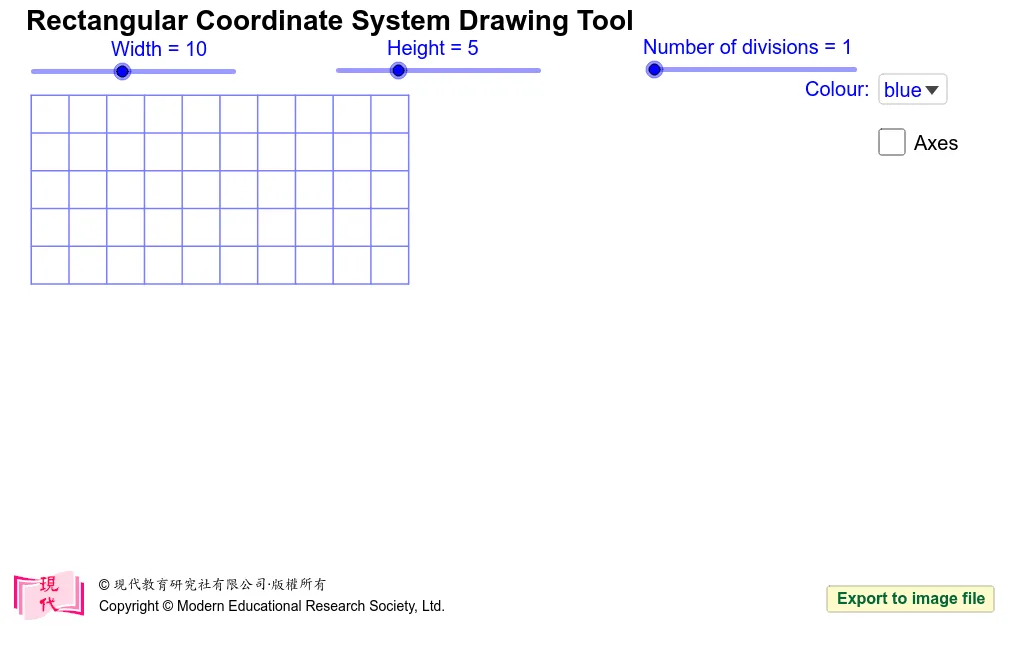
This GeoGebra example demonstrates a customizable rectangular coordinate system drawing tool for the Cartesian plane, allowing users to set axis width, height, divisions, tick marks, and labels to visualize points, vectors, and graphs. It involves core mathematical concepts in coordinate geometry, analytic geometry, vector algebra, and function graphing. The construction uses GeoGebra commands Sequence to generate coordinate lists and tick marks, Text and DynamicCoordinates for dynamic coordinate labeling, Vector to draw axes and arrowheads, and If for conditional display and label switching; key objects include width, height, xaxis, yaxis, xlist, ylist, xmark, ymark, and related label objects. Suitable for secondary school mathematics (middle and high school), this resource supports analytic geometry instruction, teacher-made courseware, and classroom exploration of function graphs and vector geometry.
GeoGebra Commands & Parameters
Sequence(Segment[(width, (-i)), (0, (-i))], i, 0, height) → HL0Sequence(Segment[(i, (-height)), (i, 0)], i, 0, width) → VL0Sequence(Sequence[Segment[(i + (j * 1 / div), (-height)), (i + (j * 1 / div), 0)], j, 1, div - 1], i, 0, width - 1) → VL1Sequence(Sequence[Segment[(width, (-i) - (j * 1 / div)), (0, (-i) - (j * 1 / div), 0)], j, 1, div - 1], i, 0, height - 1) → VL2Text("Rectangular Coordinate System Drawing Tool") → text1Sequence((i, 0.5), i, 1, width - 1) → xlistSequence((width + 0.5, (-i)), i, 1, height - 1) → ylistDynamicCoordinates(XX, x(ClosestPoint[xlist, XX]), 0.5) → XDynamicCoordinates(YY, width + 0.5, y(ClosestPoint[ylist, YY])) → YSequence(Segment[(i, y(Y)), (i, y(Y) - 0.2)], i, 1, width - 1) → xmarkSequence(Segment[(x(X), (-i)), (x(X) - 0.2, (-i))], i, 1, height - 1) → ymarkSequence(i - x(X), i, 1, width - 1) → xlabSequence(i - height - y(Y), i, 1, height - 1) → ylabSequence(If[xlab(i) ≤ -10, Element[xd, 3], If[xlab(i) < 0 ∨ xlab(i) ≥ 10, Element[xd, 2], Element[xd, 1]]], i, 1, width - 1) → xdlistSequence(If[xlab(i) ≤ -10, Element[xd, 3], If[xlab(i) < 0 ∨ xlab(i) ≥ 10, Element[xd, 2], Element[xd, 1]]], i, 1, width - 1) → l1Sequence(If[ylab(i) ≤ -10, Element[yd, 3], If[ylab(i) < 0 ∨ ylab(i) ≥ 10, Element[yd, 2], Element[yd, 1]]], i, 1, height - 1) → ydlistSequence(Text[xlab(i), (i - xdlist(i), y(Y) - 0.6), true], i, x(X) + 1, width - 1) → pxlabelSequence(Text[xlab(i), (i - xdlist(i), y(Y) - 0.6), true], i, 1, x(X) - 1) → nxlabelSequence(Text[ylab(height - i), (x(X) - ydlist(height - i), (-i) - 0.12), true], i, 1, (-y(Y)) - 1) → pylabelSequence(Text[ylab(i), (x(X) - ydlist(i), (-height) + i - 0.12), true], i, 1, height + y(Y) - 1) → nylabelVector((0, y(Y)), (width - 0.25, y(Y))) → xaxisVector((x(X), (-height)), (x(X), -0.25)) → yaxisIf(width > 2 ∧ height > 2, x(X) - 0.3, If[width > 2, x(X) - xd(1), x(X) - yd(1)]) → zxIf(width > 2 ∧ height > 2, y(Y) - 0.4, If[width > 2, y(Y) - 0.6, y(Y) - 0.12]) → zyText(0, (zx, zy)) → zero