
Interactive Stem-and-Leaf Diagram Construction Tool
Loading the math board and drawing, please wait…
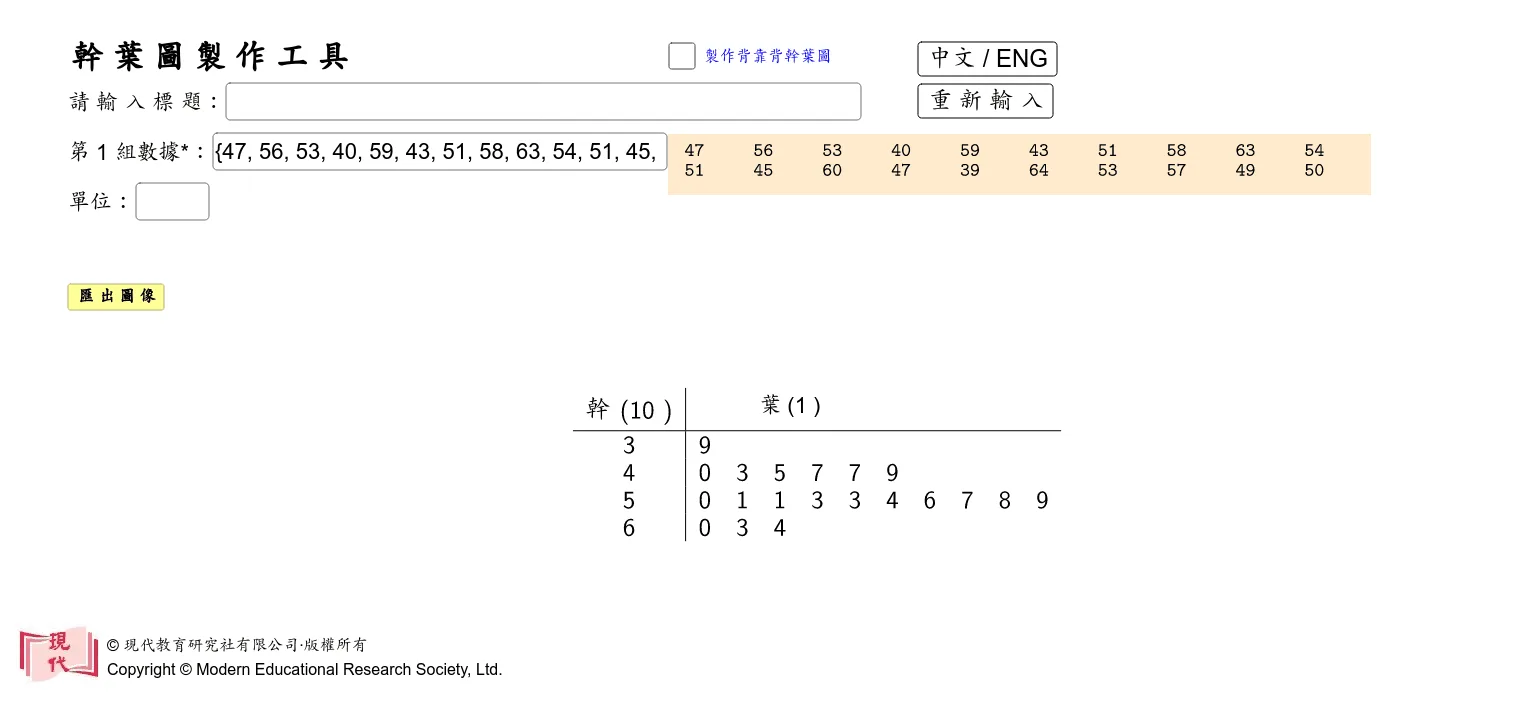
This GeoGebra example demonstrates an interactive Stem-and-Leaf Diagram Construction Tool, designed for dynamic data organization and visualization. The core mathematical concepts involved include descriptive statistics, data grouping, sorting, and the stem-and-leaf representation of quantitative datasets. To construct this tool, various GeoGebra commands such as Max, Min, Sequence, Reverse, Sort, Join, TextToUnicode, KeepIf, Length, Textfield, TableText, If, and UnicodeToText are employed alongside list objects (e.g., Data1, Data2, listStem2, list10, list20, etc.). These commands facilitate interactive text input, automatic splitting of stems and leaves, and conditional filtering to update the plot in real-time. It is highly suitable for middle school, high school, or introductory college statistics courses, serving as an excellent pedagogical aid for teachers to demonstrate data summarization and for students to explore data distributions hands-on.
GeoGebra Commands & Parameters
Max(Join[{Data1, Data2}]) → q2Min(Join[{Data1, Data2}]) → p2Min(Data1) → p1Max(Data1) → q1Sequence(i, i, v2, w2, 1) → listStem2Reverse(Sort[Data2 / c]) → list20Sort(Data1 / c) → list10Join({{Element[listStem2, 9]}, l39}) → l9Join({{Element[listStem2, 8]}, l38}) → l8Join({{Element[listStem2, 7]}, l37}) → l7Join({{Element[listStem2, 6]}, l36}) → l6Join({{Element[listStem2, 5]}, l35}) → l5Join({{Element[listStem2, 4]}, l34}) → l4Join({{Element[listStem2, 1]}, l31}) → l1Join({{Element[listStem2, 2]}, l32}) → l2Join({{Element[listStem2, 3]}, l33}) → l3TextToUnicode(Unit) → list36KeepIf(35 < x < 37, list36) → list30KeepIf(x ≠ 36, list36) → list34Max({Length[list21], Length[list22], Length[list23], Length[list24], Length[list25], Length[list26], Length[list27], Length[list28], Length[list29]}) → m2Length(Data2) → n2Length(Data1) → n1Textfield(Title) → InputBoxTitleTextfield(Data1) → InputBoxData1Sequence(i, i, v1, w1, 1) → listStem1Max({Length[list11], Length[list12], Length[list13], Length[list14], Length[list15], Length[list16], Length[list17], Length[list18], Length[list19]}) → m1Textfield(Unit) → InputBoxUnitTextToUnicode(" ") → list32Textfield(Data2) → InputBoxData2Sequence(If[n1 ≥ i, Element[Data1, i], x], i, 1, If[n1 ≥ 10, 10, n1], 1) → DataRow1_1Sequence(If[n1 ≥ i, Element[Data1, i], x], i, 11, If[n1 ≥ 20, 20, n1], 1) → DataRow2_1Sequence(If[n1 ≥ i, Element[Data1, i], 32], i, 21, If[n1 ≥ 30, 30, n1], 1) → DataRow3_1Sequence(If[n2 ≥ i, Element[Data2, i], x], i, 21, If[n2 ≥ 30, 30, n2], 1) → DataRow3_2Sequence(If[n2 ≥ i, Element[Data2, i], x], i, 1, If[n2 ≥ 10, 10, n2], 1) → DataRow1_2Sequence(If[n2 ≥ i, Element[Data2, i], x], i, 11, If[n2 ≥ 20, 20, n2], 1) → DataRow2_2TableText({DataRow1_1, DataRow2_1, DataRow3_1, "."}) → text31TableText({DataRow1_2, DataRow2_2, DataRow3_2, "."}) → text32Join({{Element[listStem1, 1]}, list11}) → l11Join({{Element[listStem1, 2]}, list12}) → l12Join({{Element[listStem1, 3]}, list13}) → l13Join({{Element[listStem1, 4]}, list14}) → l14Join({{Element[listStem1, 5]}, list15}) → l15Join({{Element[listStem1, 6]}, list16}) → l16Join({{Element[listStem1, 7]}, list17}) → l17Join({{Element[listStem1, 8]}, list18}) → l18Join({{Element[listStem1, 9]}, list19}) → l19Join({Sequence[" ", i, 1, m2 - Length[list23]], list23, l3, Sequence[" ", i, 1, m1 - Length[l33]]}) → l23Join({Sequence[" ", i, 1, m2 - Length[list22]], list22, l2, Sequence[" ", i, 1, m1 - Length[l32]]}) → l22Join({Sequence[" ", i, 1, m2 - Length[list21]], list21, l1, Sequence[" ", i, 1, m1 - Length[l31]]}) → l21Join({Sequence[" ", i, 1, m2 - Length[list24]], list24, l4, Sequence[" ", i, 1, m1 - Length[l34]]}) → l24Join({Sequence[" ", i, 1, m2 - Length[list25]], list25, l5, Sequence[" ", i, 1, m1 - Length[l35]]}) → l25Join({Sequence[" ", i, 1, m2 - Length[list26]], list26, l6, Sequence[" ", i, 1, m1 - Length[l36]]}) → l26Join({Sequence[" ", i, 1, m2 - Length[list27]], list27, l7, Sequence[" ", i, 1, m1 - Length[l37]]}) → l27Join({Sequence[" ", i, 1, m2 - Length[list28]], list28, l8, Sequence[" ", i, 1, m1 - Length[l38]]}) → l28Join({Sequence[" ", i, 1, m2 - Length[list29]], list29, l9, Sequence[" ", i, 1, m1 - Length[l39]]}) → l29Join({Sequence[" ", i, 1, m2], l10}) → l20If(b ≟ 1, TableText[l10, l11, "|010000000000_010000000000c"], b ≟ 6, TableText[l10, l11, l12, l13, l14, l15, l16, "|010000000000_010000000000c"], b ≟ 7, TableText[l10, l11, l12, l13, l14, l15, l16, l17, "|010000000000_010000000000c"], b ≟ 8, TableText[l10, l11, l12, l13, l14, l15, l16, l17, l18, "|010000000000_010000000000c"], b ≟ 9, TableText[l10, l11, l12, l13, l14, l15, l16, l17, l18, l19, "|010000000000_010000000000c"], b ≟ 2, TableText[l10, l11, l12, "|010000000000_010000000000c"], b ≟ 3, TableText[l10, l11, l12, l13, "|010000000000_010000000000c"], b ≟ 4, TableText[l10, l11, l12, l13, l14, "|010000000000_010000000000c"], b ≟ 5, TableText[l10, l11, l12, l13, l14, l15, "|010000000000_010000000000c"]) → text8Join({{124}, Sequence[48, i, 1, m2, 1], {49, 49}, Sequence[48, i, 1, m1, 1], {95, 48, 49}, Sequence[48, i, 1, d, 1], {99}}) → l30UnicodeToText(l30) → text6If(d ≟ 1, TableText[l20, l21, text6], d ≟ 6, TableText[l20, l21, l22, l23, l24, l25, l26, text6], d ≟ 7, TableText[l20, l21, l22, l23, l24, l25, l26, l27, text6], d ≟ 8, TableText[l20, l21, l22, l23, l24, l25, l26, l27, l28, text6], d ≟ 9, TableText[l20, l21, l22, l23, l24, l25, l26, l27, l28, l29, text6], d ≟ 2, TableText[l20, l21, l22, text6], d ≟ 3, TableText[l20, l21, l22, l23, text6], d ≟ 4, TableText[l20, l21, l22, l23, l24, text6], d ≟ 5, TableText[l20, l21, l22, l23, l24, l25, text6]) → text9
AI Drawing Prompt Reference
Create an interactive stem‑and‑leaf diagram tool where users can enter a title, a unit label, and two data sets through dedicated text fields. As soon as data is typed, the system automatically determines the minimum and maximum values, splits each number into a stem (the leading digit(s)) and a leaf (the trailing digit), sorts the leaves for each stem, and displays the resulting diagram in real time. The visualization updates dynamically with every change, allowing students and teachers to explore data distributions instantly. This tool is ideal for middle‑school, high‑school, and introductory college statistics classes, providing a hands‑on way to learn data organization and graphical representation.
The prompt above was compiled from the original drawing commands and is for reference only.