
Polar Graphing - Cardioid (Sine)
Loading the math board and drawing, please wait…
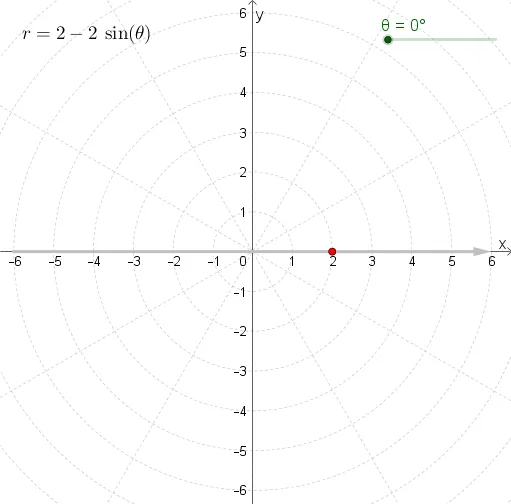
This GeoGebra example demonstrates the dynamic plotting of a cardioid in the polar coordinate system using a sine-based parametric equation. It visualizes how a sine function transforms into a heart-shaped curve under polar graphing, making the abstract relationship between polar coordinates and parametric equations concrete. Core mathematical concepts include polar coordinates, sine functions, parametric equations, and the geometric properties of cardioids. Construction involves GeoGebra commands such as CurveCartesian and Vector, with key objects θ, g, b, A, h, and text1 driving the parameter control and geometric rendering. Suitable for high school advanced mathematics, college calculus, or introductory polar coordinate courses, and serves as an effective teaching tool for interactive learning and mathematical exploration.
GeoGebra Commands & Parameters
CurveCartesian((g(b); b), b, 0, θ) → bVector(((-6 * cos(θ)), (-6 * sin(θ))), ((6 * cos(θ)), (6 * sin(θ)))) → h