
Parametric Knot Curves via Iterative Cartesian Construction
Loading the math board and drawing, please wait…
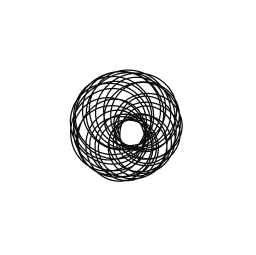
This example visualizes “knots” by constructing a space curve from parametric formulas and updating its geometry as key parameters change. It highlights how the overall knot shape emerges from controlled parameter iterations and combined components. The central math concepts include parametric curves, Cartesian coordinate plotting driven by trigonometric expressions, and aggregate computation using summation (Sum) to combine multiple terms or segments. Construction-wise, GeoGebra’s CurveCartesian is used to render the curve in Cartesian coordinates, while Sum is employed to assemble the underlying expressions. From the provided construction summary, the interactive workflow is driven by objects such as button1/button2/button3, with n controlling discretization or iteration steps, Lt/Lexp/Lr and their Next* variants updating parameters over time, MistRe/MistIm (and NextMistRe/NextMistIm) managing real/imaginary (or component) iterates, and auxiliary controls like h, speed, p, f, val, and c governing step size, progression speed, and function parameters. The included Cols helps organize computed columns/sets for plotting. Suitable for advanced high school and undergraduate users in math visualization, parametric modeling, and computational geometry labs.
GeoGebra Commands & Parameters
Sum(Zip[real(((r * exp((ί * t))) * exp(((ί * x) * m)))), r, Lr, t, Lt, m, Lexp]) → MistReSum(Zip[imaginary(((r * exp((ί * t))) * exp(((ί * x) * m)))), r, Lr, t, Lt, m, Lexp]) → MistImSum(Zip[real(((r * exp((ί * t))) * exp(((ί * x) * m)))), r, NextLr, t, NextLt, m, NextLexp]) → NextMistReSum(Zip[imaginary(((r * exp((ί * t))) * exp(((ί * x) * m)))), r, NextLr, t, NextLt, m, NextLexp]) → NextMistImCurveCartesian((MistRe(t) * val) + (NextMistRe(t) * (1 - val)), (MistIm(t) * val) + (NextMistIm(t) * (1 - val)), t, 0, (2 * π)) → c
AI Drawing Prompt Reference
Draw a parametric curve graph, specifically "knots" (knots), constructed via iterative Cartesian coordinates. The graph consists of iterative real and imaginary parts (or components), driven by trigonometric expressions. The construction order is to first compute real and imaginary parts, then update parameters, and finally draw the curve in Cartesian coordinates. Parameters such as n, Lt, Lexp, and Lr can be adjusted to control discretization or iteration steps.
The prompt above was compiled from the original drawing commands and is for reference only.