
Polar Coordinates by David Beydler
Loading the math board and drawing, please wait…
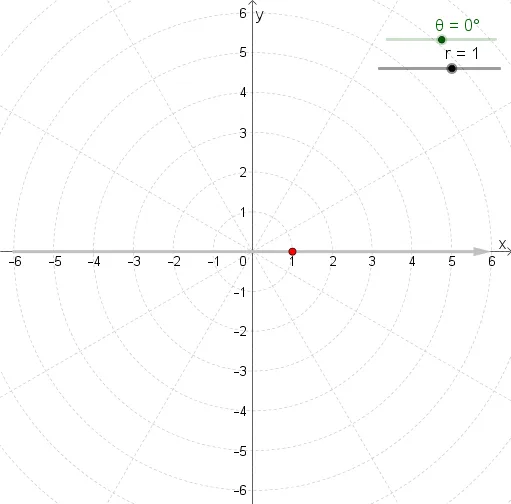
This example demonstrates the representation of points and graphing in polar coordinates. It involves core mathematical concepts such as the definition of polar coordinates, vectors, function graphs, and differential calculus. The construction uses GeoGebra commands like Vector and objects θ, h, r, A. Suitable for high school and above students to learn about the application and properties of polar coordinates.
GeoGebra Commands & Parameters
Vector(((-6 * cos(θ)), (-6 * sin(θ))), ((6 * cos(θ)), (6 * sin(θ)))) → h
AI Drawing Prompt Reference
Draw a polar coordinate diagram featuring a straight line segment passing through the origin, with endpoints at radius 6 in opposite directions, rotating as the angle changes. Include a movable point whose position is determined by polar coordinates (radius and angle), and show a vector from the origin to this point. Add a polar grid with concentric circles and radial lines to illustrate the relationship between coordinates and the function graph. The diagram should clearly demonstrate point representation, vector direction, and the effect of angle variation on position.
The prompt above was compiled from the original drawing commands and is for reference only.