
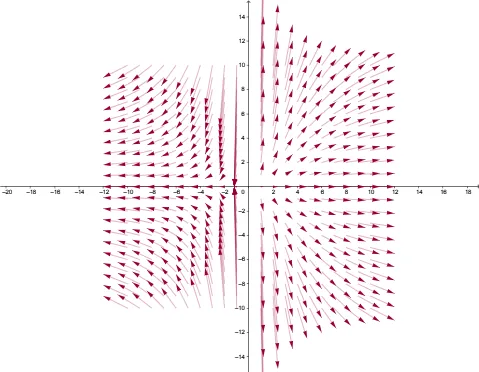
2D Vector Field on Grid Demo
Loading the math board and drawing, please wait…
This example demonstrates the visualization of vector fields in 2D space. Key math concepts include vectors, linear equations, similarity transformations, and vector field analysis in calculus. Construction highlights the use of GeoGebra commands like Sequence, Textfield, Spacing, Extent, Scale, xcomp, ycomp, GridPoints, VectorsList, InputBox1, InputBox2, and text1. Suitable for high school and above students studying vector calculus, linear algebra, and field theory in physics.
GeoGebra Commands & Parameters
Sequence(Sequence[(i, j), i, (-Extent), Extent, Spacing], j, (-Extent), Extent, Spacing) → GridPointsSequence(Sequence[Vector[(i, j), (i, j) + (Scale * (xcomp(i, j), ycomp(i, j)))], i, (-Extent), Extent, Spacing], j, (-Extent), Extent, Spacing) → VectorsListTextfield(xcomp) → InputBox1Textfield(ycomp) → InputBox2
AI Drawing Prompt Reference
Draw a 2D vector field on a grid. First, create a grid of points, then draw a vector at each point, with the direction and length determined by the input values in the x and y components. Finally, adjust the scale of the vectors for better visibility.
The prompt above was compiled from the original drawing commands and is for reference only.