
Odds or Evens Statistics and Function Graphs
Loading the math board and drawing, please wait…
In collections
Introduction to Probability
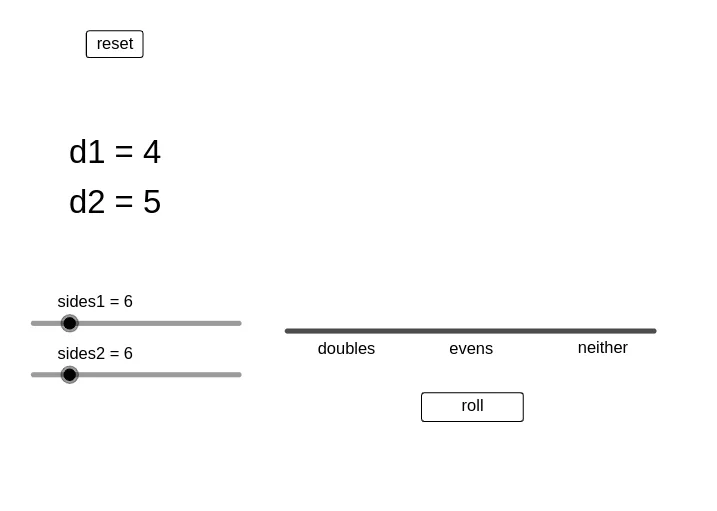
This example demonstrates the relationship between statistical distributions of odd and even numbers and function graphs through interactive visualization. Core math concepts include Probability & Statistics, Step Functions, Vectors, and Optimization Problems. Construction highlights involve commands like Sequence, RandomElement, Join, Segment, DotPlot, and Slider Animation in GeoGebra for data generation and visualization. Suitable for high school and above mathematics education focusing on probability and function graphing.
GeoGebra Commands & Parameters
Sequence(a, a, 1, sides1) → d1Sequence(a, a, 1, sides2) → d2RandomElement(d1) → r1RandomElement(d2) → r2Join({Sequence[1, a, 1, doubles], Sequence[2, a, 1, evens], Sequence[3, a, 1, lose]}) → L_1Segment((0.5, 0), (3.5, 0)) → fDotPlot(L_1, false, 0.2) → L_2
AI Drawing Prompt Reference
Create a diagram combining statistics and function graphs. Start by generating two random integer sequences along a horizontal axis, representing outcomes from two dice or choices. Then, categorize the results into three groups: 'doubles', 'evens', and 'losses', and display their frequency distributions using a dot plot above the axis. Additionally, draw a horizontal line segment from 0.5 to 3.5 below the axis as a reference baseline. The overall figure should illustrate the relationship between random data distribution and a simple step-like function, suitable for teaching probability and statistics.
The prompt above was compiled from the original drawing commands and is for reference only.