
Empirical vs Theoretical Histograms: Convergence with Increasing Trials
Loading the math board and drawing, please wait…
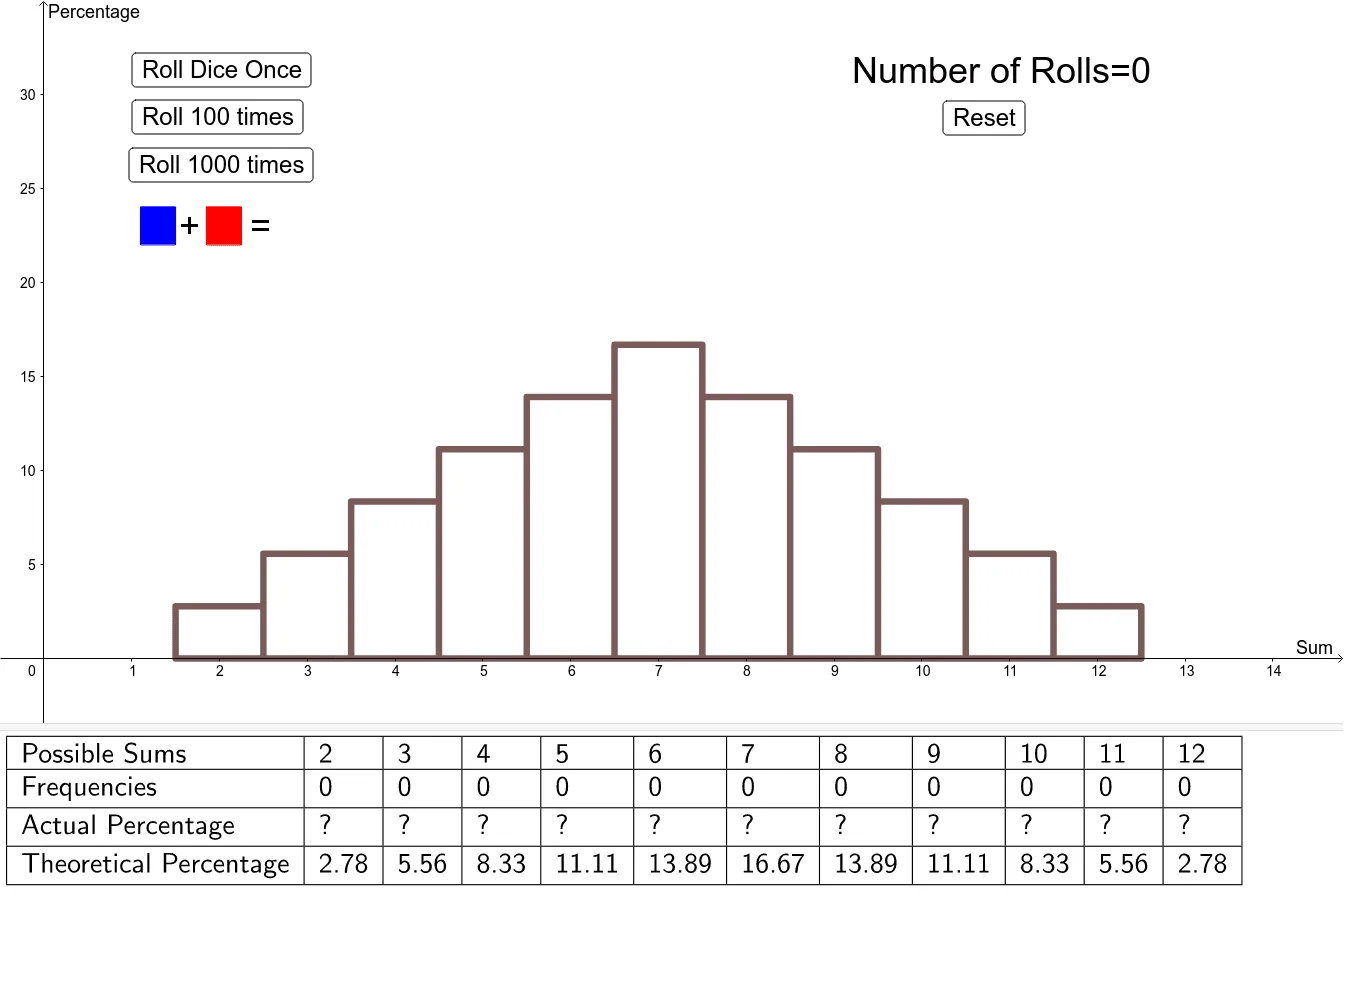
① This GeoGebra example dynamically demonstrates how empirical (experimental) histograms converge to theoretical histograms as the number of trials (dice rolls) increases. ② Core mathematical concepts include frequency vs probability, the law of large numbers, histogram representation, and the distribution of discrete random variables (e.g., sum of two dice). ③ Construction details: Uses GeoGebra commands such as Polygon, Append, TableText, and Histogram; objects include s2 through s12 (frequencies for each sum), sums, Rolls, probs, button1 (roll button), classes, thProb (theoretical probabilities), PossibleSums, text1, button2, A-H, poly1, poly2, d1, text2, d2, text3, button3, button4, Tsums, TthProb, Tprobs, and Tpossible. Buttons control the number of trials and dynamically update the graphs. ④ Suitable for high school or college probability/statistics courses to illustrate the law of large numbers and the stabilization of relative frequencies, and for mathematical experiments or inquiry-based learning.
GeoGebra Commands & Parameters
Polygon({(1.1, 22), (1.1, 24), (1.5, 24), (1.5, 22)}) → poly1Polygon({(1.85, 22), (1.85, 24), (2.25, 24), (2.25, 22)}) → poly2Append("Frequencies", sums) → TsumsAppend("Theoretical Percentage", (thProb * 100)) → TthProbAppend("Actual Percentage", (probs * 100)) → TprobsAppend("Possible Sums", PossibleSums) → TpossibleTableText({Tpossible, Tsums, Tprobs, TthProb}, "|_") → text5Histogram(classes, (probs * 100)) → ExHistHistogram(classes, (thProb * 100)) → ThHist
AI Drawing Prompt Reference
Create a dynamic comparison between an empirical frequency histogram and a theoretical probability histogram. First, draw two rectangles to represent the histogram boundaries. Then, create a button to increase the number of trials, which updates the empirical frequency histogram and displays actual percentages, theoretical percentages, and possible sums. Finally, draw the theoretical probability histogram to show how the empirical frequency histogram converges to the theoretical probability histogram as the number of trials increases.
The prompt above was compiled from the original drawing commands and is for reference only.