
Polar Graph Construction by Doug Ray
Loading the math board and drawing, please wait…
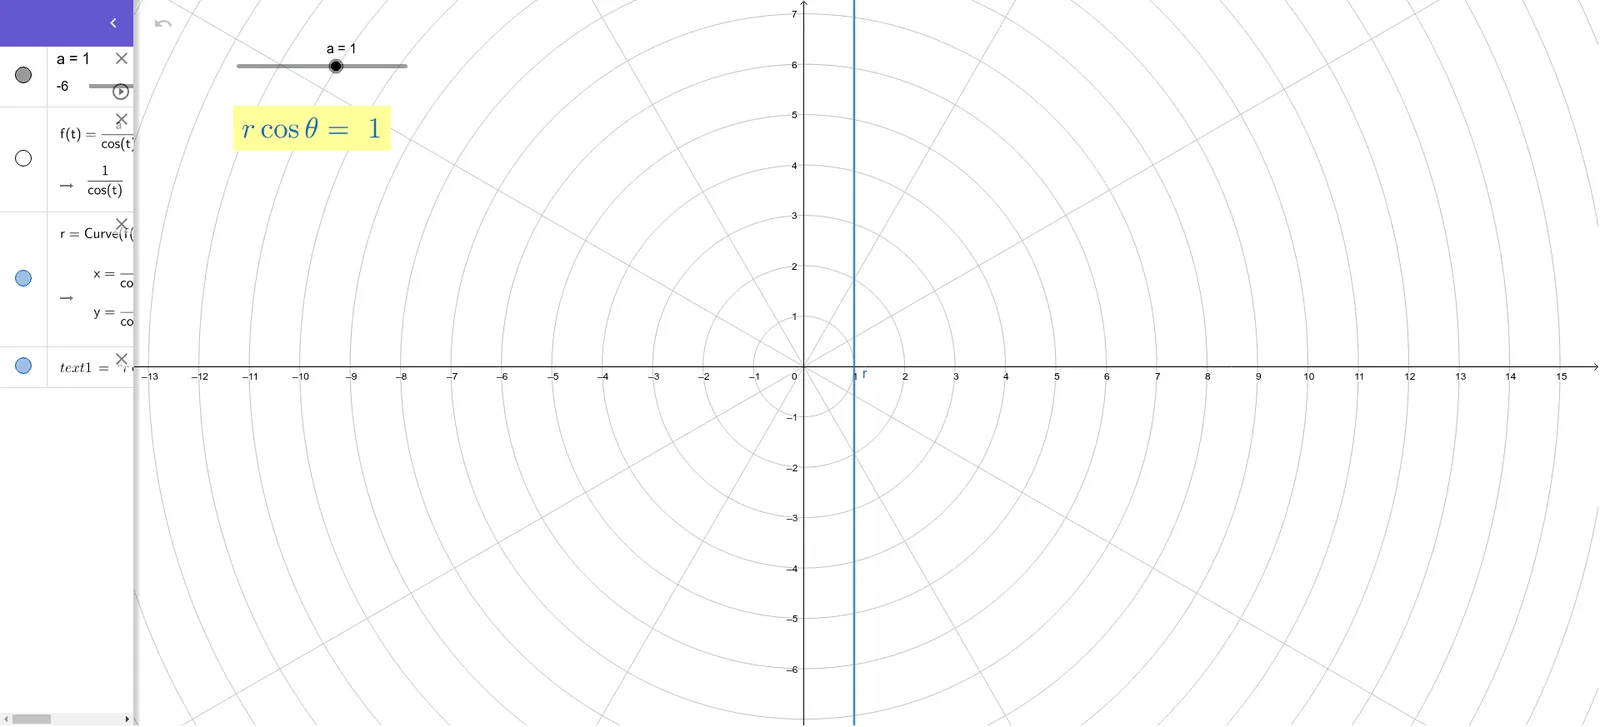
This example demonstrates how to plot functions using polar coordinates, particularly focusing on combinations of exponential and linear equations. Key math concepts include polar coordinate systems, exponential functions, linear equations, curve sketching, and fractal geometry. The construction utilizes GeoGebra's CurveCartesian command to plot Cartesian curves, with parameters defined by objects a, f, r, and text annotations via text1. Suitable for high school and above students learning about polar graphs and parametric equations.
GeoGebra Commands & Parameters
CurveCartesian((f(t) * cos(t)), (f(t) * sin(t)), t, 0, (2 * π)) → r
AI Drawing Prompt Reference
Plot a polar graph using a combination of exponential and linear equations. First, set a parameter t from 0 to 2π. Then, use the CurveCartesian command with f(t) * cos(t) as the x-coordinate and f(t) * sin(t) as the y-coordinate to draw the curve. f(t) is a function of t, which can be an exponential function or another form of function.
The prompt above was compiled from the original drawing commands and is for reference only.