
Polar Graph - 9
Loading the math board and drawing, please wait…
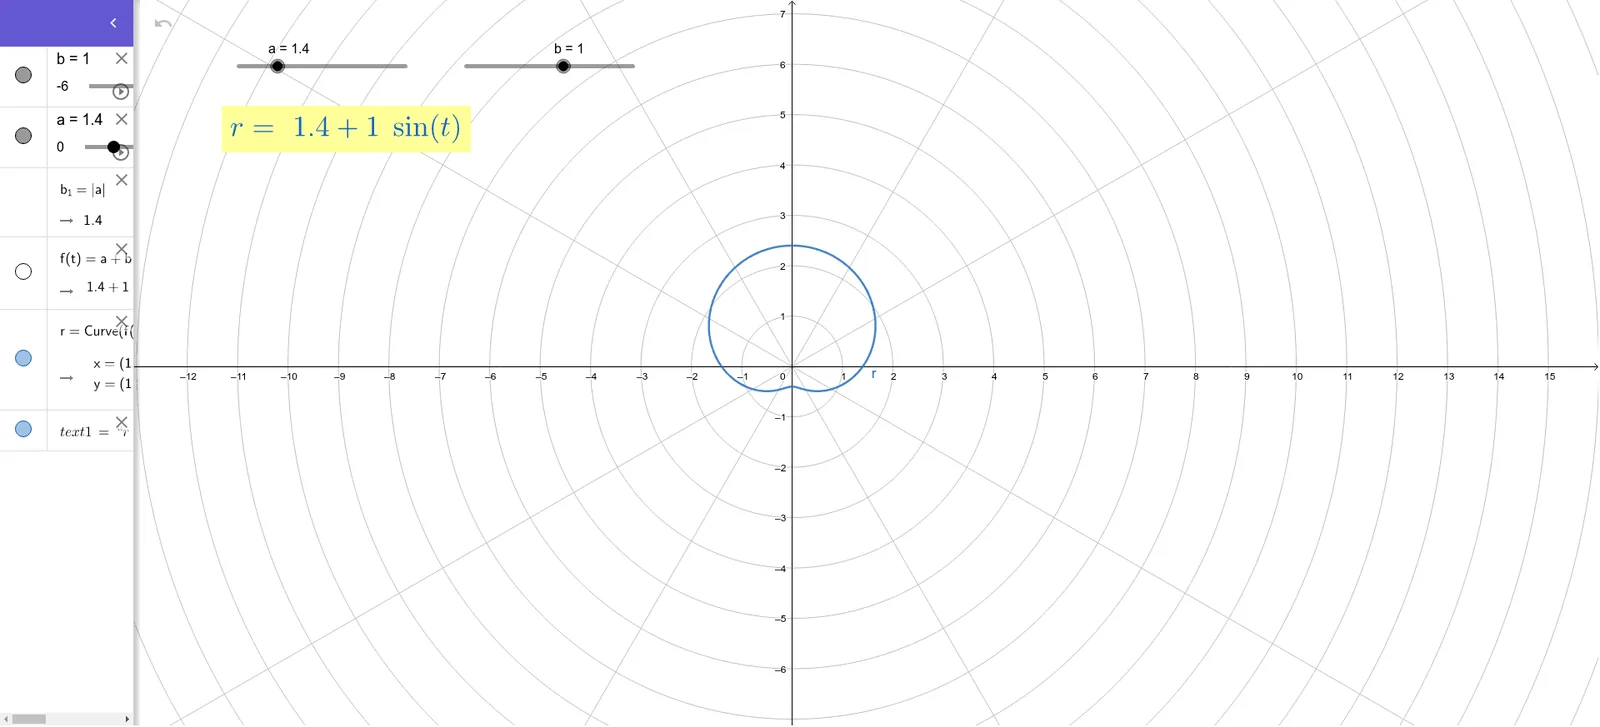
This example demonstrates the method of drawing polar graphs. It involves functions and trajectories in the polar coordinate system. Using the CurveCartesian command, specific polar coordinate curves can be plotted. Suitable for high school mathematics education and learning.
GeoGebra Commands & Parameters
CurveCartesian((f(t) * cos(t)), (f(t) * sin(t)), t, 0, (2 * π)) → r
AI Drawing Prompt Reference
Draw a polar coordinate graph. Define a curve in the polar plane where the x-coordinate is a function value times the cosine of the angle, and the y-coordinate is the same function value times the sine of the angle. Let the angle vary from zero to two pi, producing a smooth trajectory that may be closed or open. The curve should radiate from the origin, showing how the function changes with angle. Include coordinate axes for reference. This graph is suitable for high school math education.
The prompt above was compiled from the original drawing commands and is for reference only.