
Polar Graphs - 8 by Doug Ray
Loading the math board and drawing, please wait…
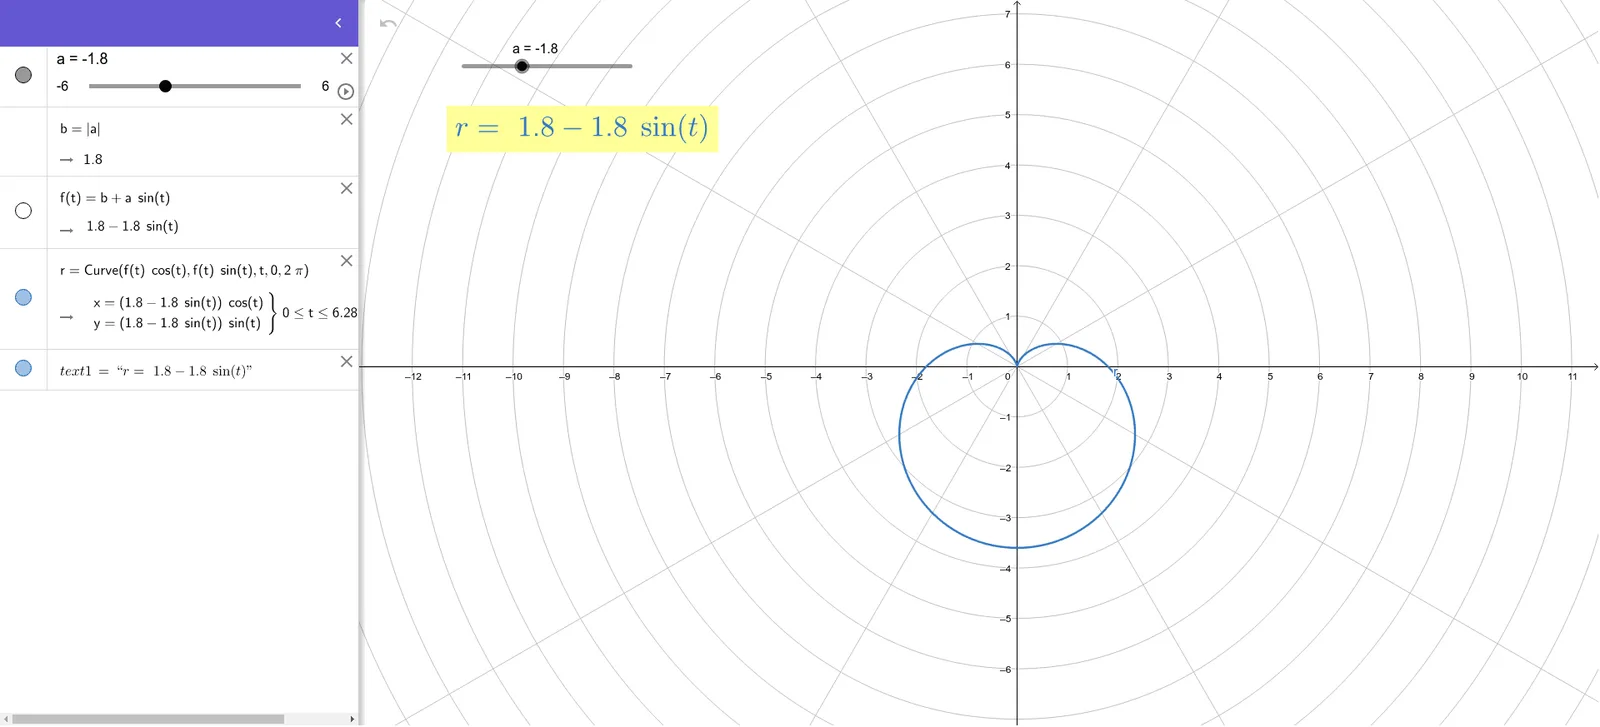
This example demonstrates the creation of polar graphs. It involves functions in the polar coordinate system, and the CurveCartesian command is used to draw specific polar curves. Suitable for high school mathematics education, particularly for coordinate geometry and trigonometry.
GeoGebra Commands & Parameters
CurveCartesian((f(t) * cos(t)), (f(t) * sin(t)), t, 0, (2 * π)) → r
AI Drawing Prompt Reference
Create a polar graph based on polar coordinates using sine and cosine functions to generate a spiral. First, draw a unit circle with radius 1, then use the parametric equation (f(t) * cos(t), f(t) * sin(t)) to generate an outward-expanding spiral, with t ranging from 0 to 2π.
The prompt above was compiled from the original drawing commands and is for reference only.