
Polar Graphs - 10: Ellipse and Integral Curves in Polar Coordinates
Loading the math board and drawing, please wait…
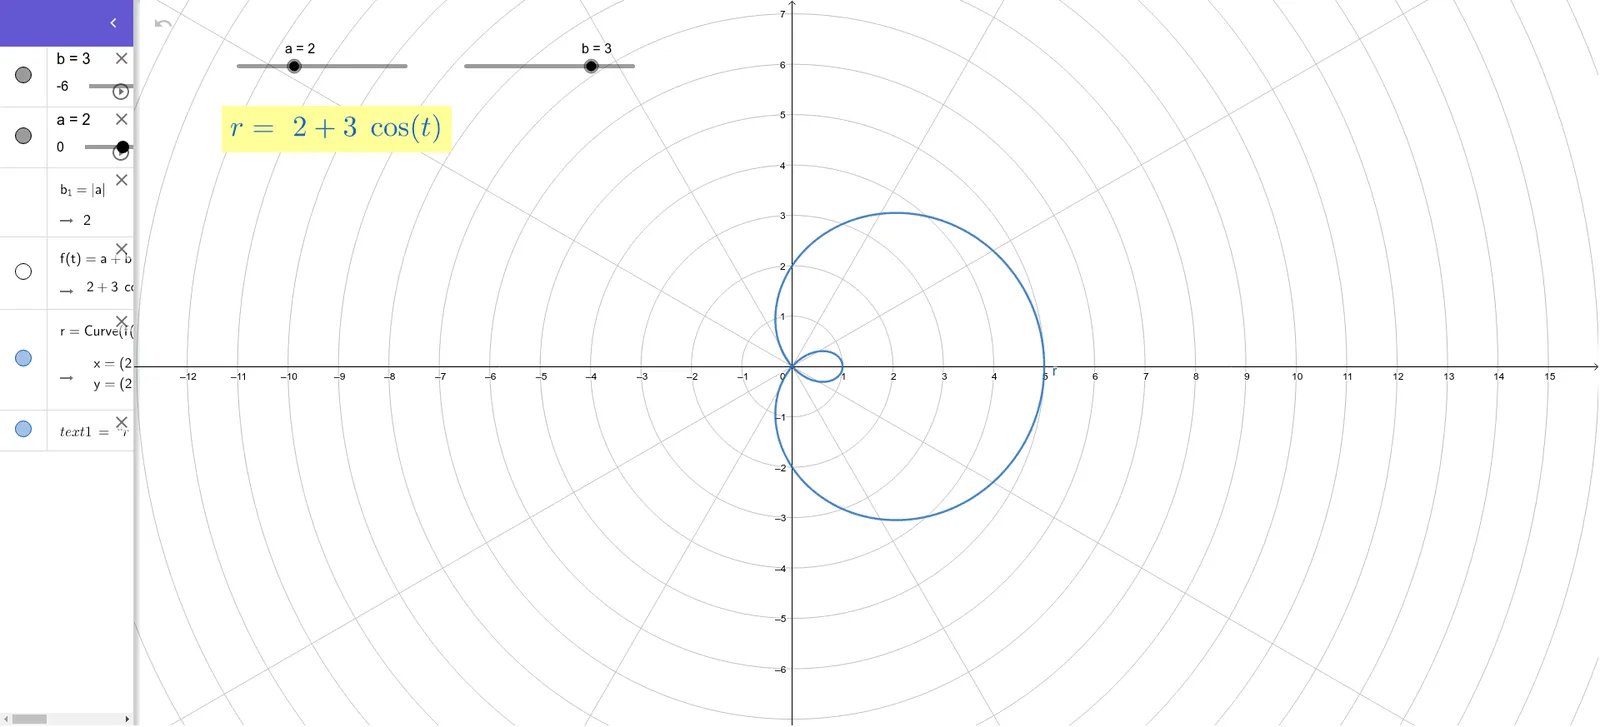
①This example demonstrates the combined plotting of various polar graphs, including ellipses and integral-related curves, as part of the 'Polar Graphs' series (case 10). ②Core mathematical concepts include polar-to-Cartesian coordinate transformation, parametric equations, the standard equation of an ellipse, the geometric interpretation of definite integrals, and linear regression fitting, along with elements of standard deviation and prism geometry, showcasing interdisciplinary mathematical integration. ③Construction highlights: The GeoGebra command CurveCartesian is used to generate curves, involving objects such as parameters b, a, b_1, function f, polar radius r, and text1. By adjusting parameters and function expressions, different polar graphs are produced, possibly with sliders for dynamic exploration. ④Suitable for high school to undergraduate mathematics education, this example serves as a classroom demonstration or self-study tool for understanding polar coordinates, analytic geometry, and introductory calculus, revealing connections between diverse mathematical topics.
GeoGebra Commands & Parameters
CurveCartesian((f(t) * cos(t)), (f(t) * sin(t)), t, 0, (2 * π)) → r