
Polar Graphs - 11: Parametric Curves with Trigonometric Functions
Loading the math board and drawing, please wait…
In collections
Polar Graphs - Investigation
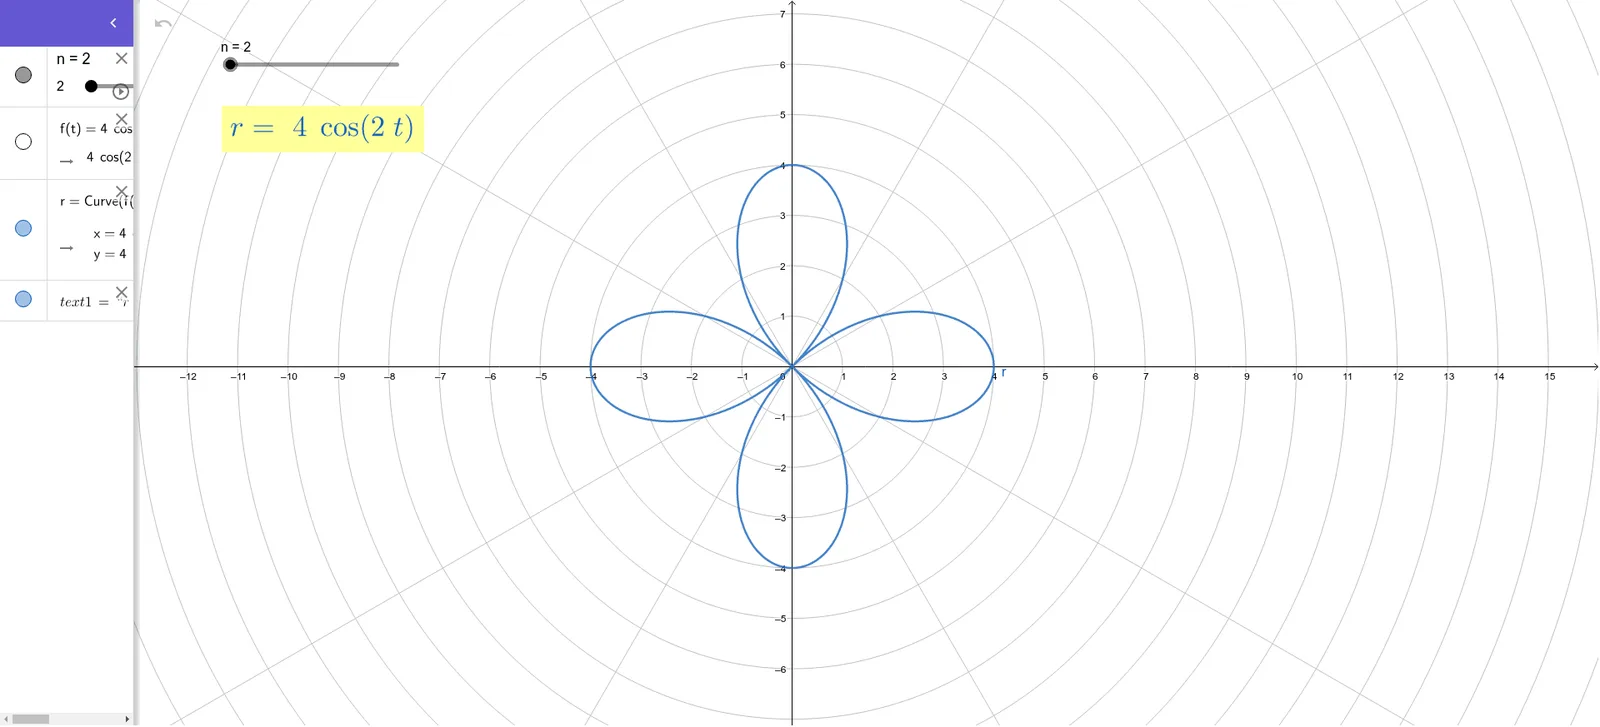
①This example demonstrates the 11th polar graph in a series, plotting a parametric curve in polar coordinates that often exhibits petal-like or spiral patterns. ②Core mathematical concepts include polar coordinates, parametric equations, trigonometric functions (sine/cosine) affecting the radial distance, and possibly sequences/series in the construction. ③Construction highlights: Based on the summary, the GeoGebra command CurveCartesian is used, with objects n (likely a parameter or sequence index), f (function), r (radius or polar distance), and text1 (text label). Adjusting n and f dynamically changes the curve's shape. ④Suitable for high school or early college students learning polar coordinates, parametric equations, and trigonometric graphing, as well as for exploratory math labs to visualize how the radius varies with angle.
GeoGebra Commands & Parameters
CurveCartesian((f(t) * cos(t)), (f(t) * sin(t)), t, 0, (2 * π)) → r
AI Drawing Prompt Reference
Draw a polar curve with parameter t, where the radius r is determined by trigonometric functions sin and cos, forming patterns similar to petals or spirals. Adjust the range of t from 0 to 2π to observe changes in the curve's shape.
The prompt above was compiled from the original drawing commands and is for reference only.