
Plotting Points on the Cartesian Plane
Loading the math board and drawing, please wait…
In collections
CLASS IX CBSE MATHS ACTIVITIES
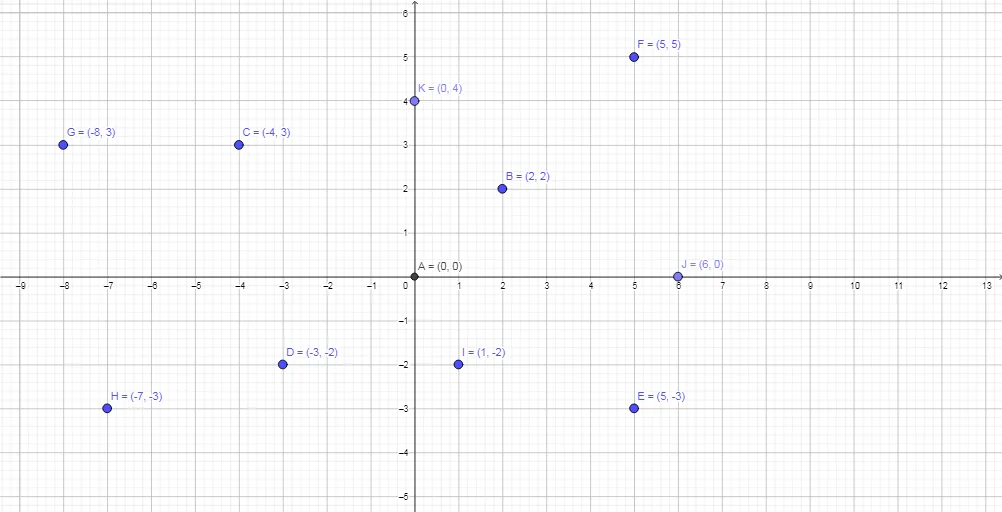
This example demonstrates how to plot multiple points on a Cartesian plane, illustrating basic concepts of coordinate systems. Key mathematical concepts include coordinate representation, coordinate transformations, and geometric construction. The construction involves using GeoGebra's Intersect command and Point objects to locate points A through J. Suitable for middle school students learning geometry fundamentals or for mathematical teaching demonstrations.
GeoGebra Commands & Parameters
Intersect(xAxis, yAxis) → APoint(xAxis) → JPoint(yAxis) → K
AI Drawing Prompt Reference
On a Cartesian plane with perpendicular x-axis and y-axis, mark the intersection point of the two axes as the origin. Then place one arbitrary point on the x-axis and another arbitrary point on the y-axis. The figure consists of the two axes, the central origin point, and two separate points lying on each axis. Construct the origin first, then add the point on the horizontal axis, and finally add the point on the vertical axis. This illustrates basic coordinate plotting for educational purposes.
The prompt above was compiled from the original drawing commands and is for reference only.