
Planets Retrograde Curve
Loading the math board and drawing, please wait…
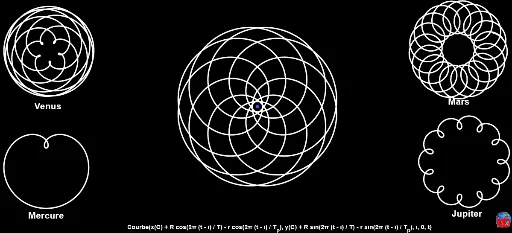
This example demonstrates the retrograde curve of planets. It involves basic concepts from astronomy and parametric equations. Using GeoGebra commands like CurveCartesian, users can construct the motion trajectories of planets. Suitable for high school students or astronomy enthusiasts.
GeoGebra Commands & Parameters
CurveCartesian(x(B) + (2.2 * cos(((2 * π) * (t - i) / 2) - π / 2)) - (3.5 * cos(((2 * π) * (t - i) / 4) - π / 2)), y(B) + (2.2 * sin(((2 * π) * (t - i) / 2) - π / 2)) - (3.52 * sin(((2 * π) * (t - i) / 4) - π / 2)), i, 0, 4.29) → MercureCurveCartesian(x(D) + (3.19 * cos(((2 * π) * (t - i) / 1.9))) - (2.07 * cos(((2 * π) * (t - i) / 1.108))), y(D) + (3.19 * sin(((2 * π) * (t - i) / 1.9))) - (2.07 * sin(((2 * π) * (t - i) / 1.108))), i, 0, 13.52) → VenusCurveCartesian(x(H) - (0.62 * cos(((2 * π) * t) - i)) - (4.85 * cos(((2 * π) * (t - i) / 60))), y(H) - (0.62 * sin(((2 * π) * t) - i)) - (4.85 * sin(((2 * π) * (t - i) / 60))), i, 0, 66) → SaturneCurveCartesian(x(G) - (0.76 * cos(((2 * π) * (t - i) / 5))) - (4.6 * cos(((2 * π) * (t - i) / 60))), y(G) - (0.76 * sin(((2 * π) * (t - i) / 5))) - (4.6 * sin(((2 * π) * (t - i) / 60))), i, 0, 60) → JupiterCurveCartesian(x(C) + (R * cos(((2 * π) * (t - i) / aa))) - (r * cos(((2 * π) * (t - i) / bb))), y(C) + (R * sin(((2 * π) * (t - i) / aa))) - (r * sin(((2 * π) * (t - i) / bb))), i, 0, t) → cCurveCartesian(x(A) + (3.8 * cos(((2 * π) * (7.62 - i) / 7.6))) - (1.93 * cos((((2 * π) * 7.62) - i) / 0.067)), y(A) + (3.8 * sin(((2 * π) * (7.62 - i) / 7.6))) - (1.93 * sin((((2 * π) * 7.62) - i) / 0.067)), i, 0, 7.62) → Mars
AI Drawing Prompt Reference
Draw the retrograde curves of Mercury, Venus, Mars, Jupiter, and Saturn. Start with Mercury's curve using x(t) = 2.2 * cos(2π(t - i)/2 - π/2) - 3.5 * cos(2π(t - i)/4 - π/2), y(t) = 2.2 * sin(2π(t - i)/2 - π/2) - 3.52 * sin(2π(t - i)/4 - π/2), i from 0 to 4.29. Then draw Venus's curve with x(t) = 3.19 * cos(2π(t - i)/1.9) - 2.07 * cos(2π(t - i)/1.108), y(t) = 3.19 * sin(2π(t - i)/1.9) - 2.07 * sin(2π(t - i)/1.108), i from 0 to 13.52. Next, draw Mars's curve using x(t) = R * cos(2π(t - i)/7.62) - r * cos(2π(t - i)/0.067), y(t) = R * sin(2π(t - i)/7.62) - r * sin(2π(t - i)/0.067), i from 0 to 7.62. After that, draw Jupiter's curve with x(t) = 0.76 * cos(2π(t - i)/5) - 4.6 * cos(2π(t - i)/60), y(t) = 0.76 * sin(2π(t - i)/5) - 4.6 * sin(2π(t - i)/60), i from 0 to 60. Finally, draw Saturn's curve using x(t) = -0.62 * cos(2πt - i) - 4.85 * cos(2π(t - i)/60), y(t) = -0.62 * sin(2πt - i) - 4.85 * sin(2π(t - i)/60), i from 0 to 66.
The prompt above was compiled from the original drawing commands and is for reference only.