
Pi Made of Functions: Combining Multiple Function Graphs
Loading the math board and drawing, please wait…
In collections
Function Arts
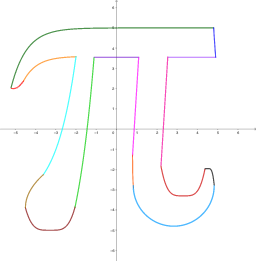
① This example demonstrates how multiple different types of function graphs can be cleverly combined on a coordinate plane to form the shape of the Greek letter π (pi), showing that complex figures can be built from simple function curves. ② Core mathematical concepts include exponential, logarithmic, linear, polynomial, and quadratic functions, as well as transformations such as translation, scaling, and superposition of graphs. It also touches on applied topics like frequency distribution, hypergeometric distribution, and interest calculation, but the main focus is on constructing and combining function graphs. ③ Construction highlights: According to the summary, 16 function objects (f, g, h, j, k, l, m, n, p, q, r, s, t, u, v, w) are used, each likely representing a curve or region; by adjusting expressions and domains, the segments are pieced together to outline the strokes of π, showcasing GeoGebra's flexibility in defining and overlaying functions. ④ Suitable for middle and high school mathematics teaching, especially for function lessons, as well as for math culture displays or recreational math activities, helping students grasp basic shapes of functions and creative combinations to stimulate interest in learning functions.
GeoGebra Commands & Parameters
f(x) = If[-5.21 ≤ x ≤ 4.8, (-5 * ℯ^((-1.3 * x) - 7.3)) + 5]g(x) = If[-4.6 ≤ x ≤ -2, (-5 * ℯ^((-1.5 * x) - 8.3)) + 3.6]h(x) = If[-5.2 ≤ x ≤ -4.6, (1.5 * (x + 5.1)^(2)) + 2]j(x) = If[-1.1 ≤ x ≤ 1.1, 3.55]k(x) = If[2.55 ≤ x ≤ 4.9, 3.55]l(x) = If[-3.6 ≤ x ≤ -2, (4 * ℯ^(x + 2.6)) - 3.7]m(x) = If[-2.05 ≤ x ≤ -1.11, (100 * ℯ^(x - 1)) - 8.6]n(x) = If[0.79 ≤ x ≤ 1.095, (16 * x) - 14]p(x) = If[2.2 ≤ x ≤ 2.535, (16 * x) - 37]q(x) = If[-4.5 ≤ x ≤ -2.05, (0.5 * (x + 3.28)^(4)) - 5]r(x) = If[x ≤ -3.62, (0.5 * sqrt((12 * (x + 4.5)))) - 3.88]s(x) = If[0.792 ≤ x ≤ 0.84, (-0.5 * ln(x - 0.79)) - 4.4]t(x) = If[2.2 ≤ x ≤ 4.37, (x - 3.3)^(4) - 3.3]u(x) = (-(sqrt(4 - (x - 2.83)^(2)) + 2.8))v(x) = If[4.38 ≤ x ≤ 4.828, (-70 * (x - 4.5)^(4)) - 1.95]w(x) = If[4.8 ≤ x ≤ 4.9, (-14.5 * x) + 74.6]
AI Drawing Prompt Reference
Draw a graph composed of multiple function curves that resemble the Greek letter π. Include curves such as exponential, logarithmic, linear, quadratic, and polynomial functions. Each curve has specific domains and expressions, and by combining them, the outline of π can be formed. Ensure the curves are properly overlaid on the coordinate plane to show the superposition effect of different functions.
The prompt above was compiled from the original drawing commands and is for reference only.