
Pi Approximation with Monte Carlo Method
Loading the math board and drawing, please wait…
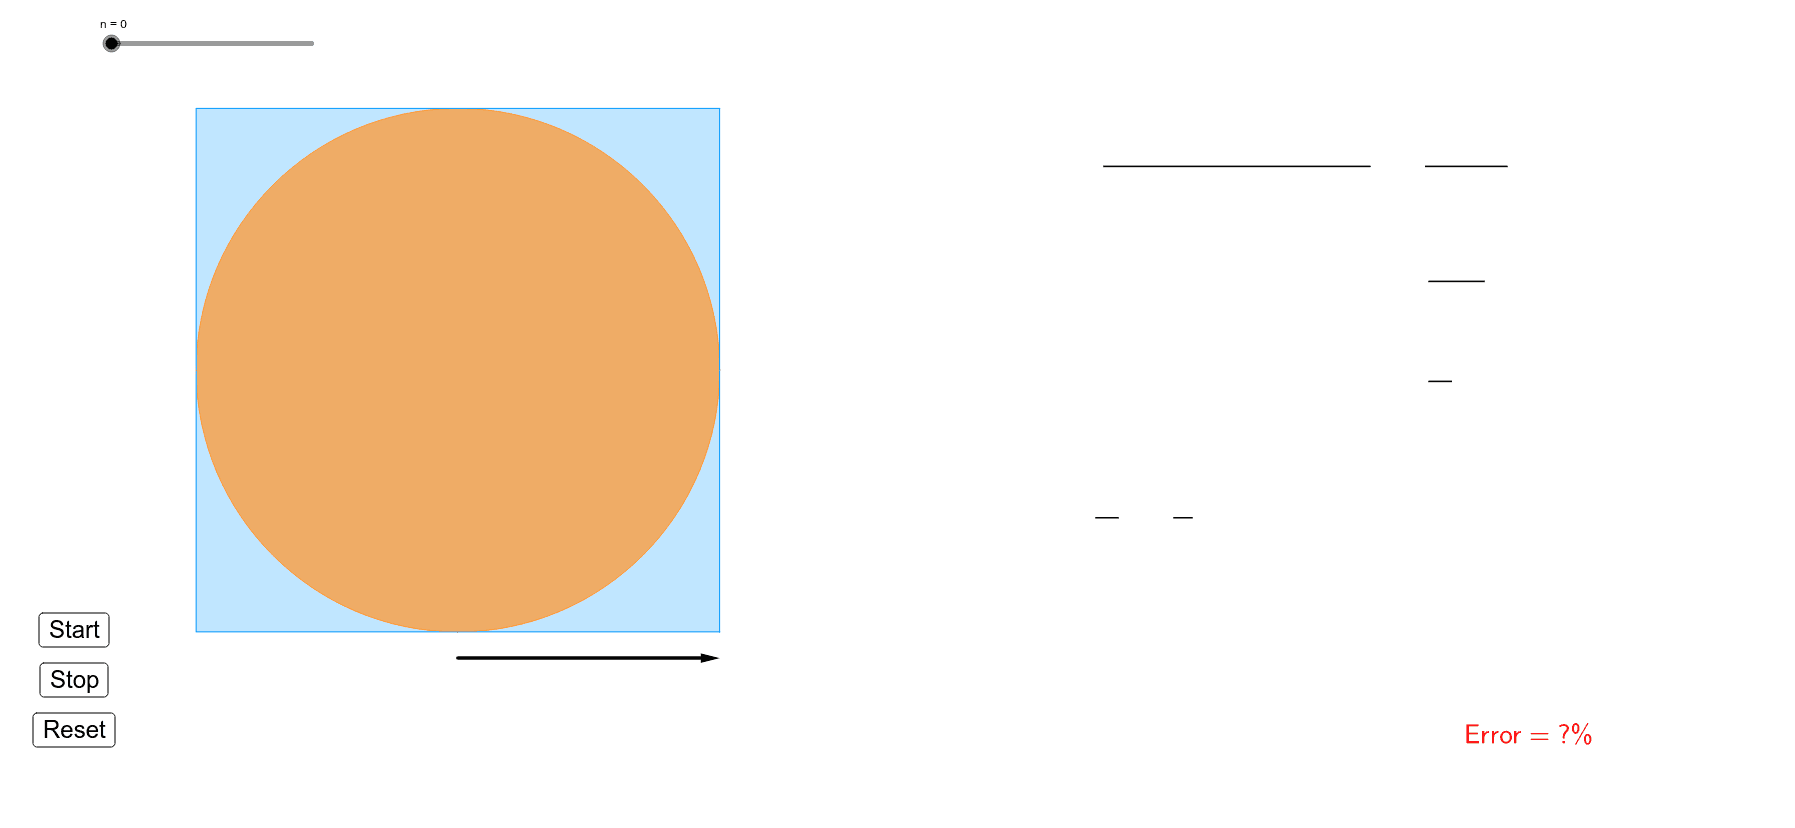
This example demonstrates how to approximate the value of pi (π) using the Monte Carlo method. Key mathematical concepts include probability and geometry. By constructing a square and an inscribed circle, and randomly generating points to count how many fall within the circle, the value of π can be estimated. GeoGebra commands used include Polygon, Vector, Sequence, and Sum. Suitable for high school mathematics education and learning probability and statistics.
GeoGebra Commands & Parameters
Polygon((0, 0), (1, 0), (1, 1), (0, 1)) → poly1, a, b, c, dVector((0.5, -0.05), (1, -0.05)) → uSequence(RandomUniform[0, 1], k, 1, n) → list1Sequence(RandomUniform[0, 1], k, 1, n) → list2Sequence((Element[list1, k], Element[list2, k]), k, 1, n) → list3Sequence(If[(Element[list1, k] - 0.5)^(2) + (Element[list2, k] - 0.5)^(2) ≤ 0.5^(2), 1, 0], k, 1, n) → list4Sum(list4) → f