
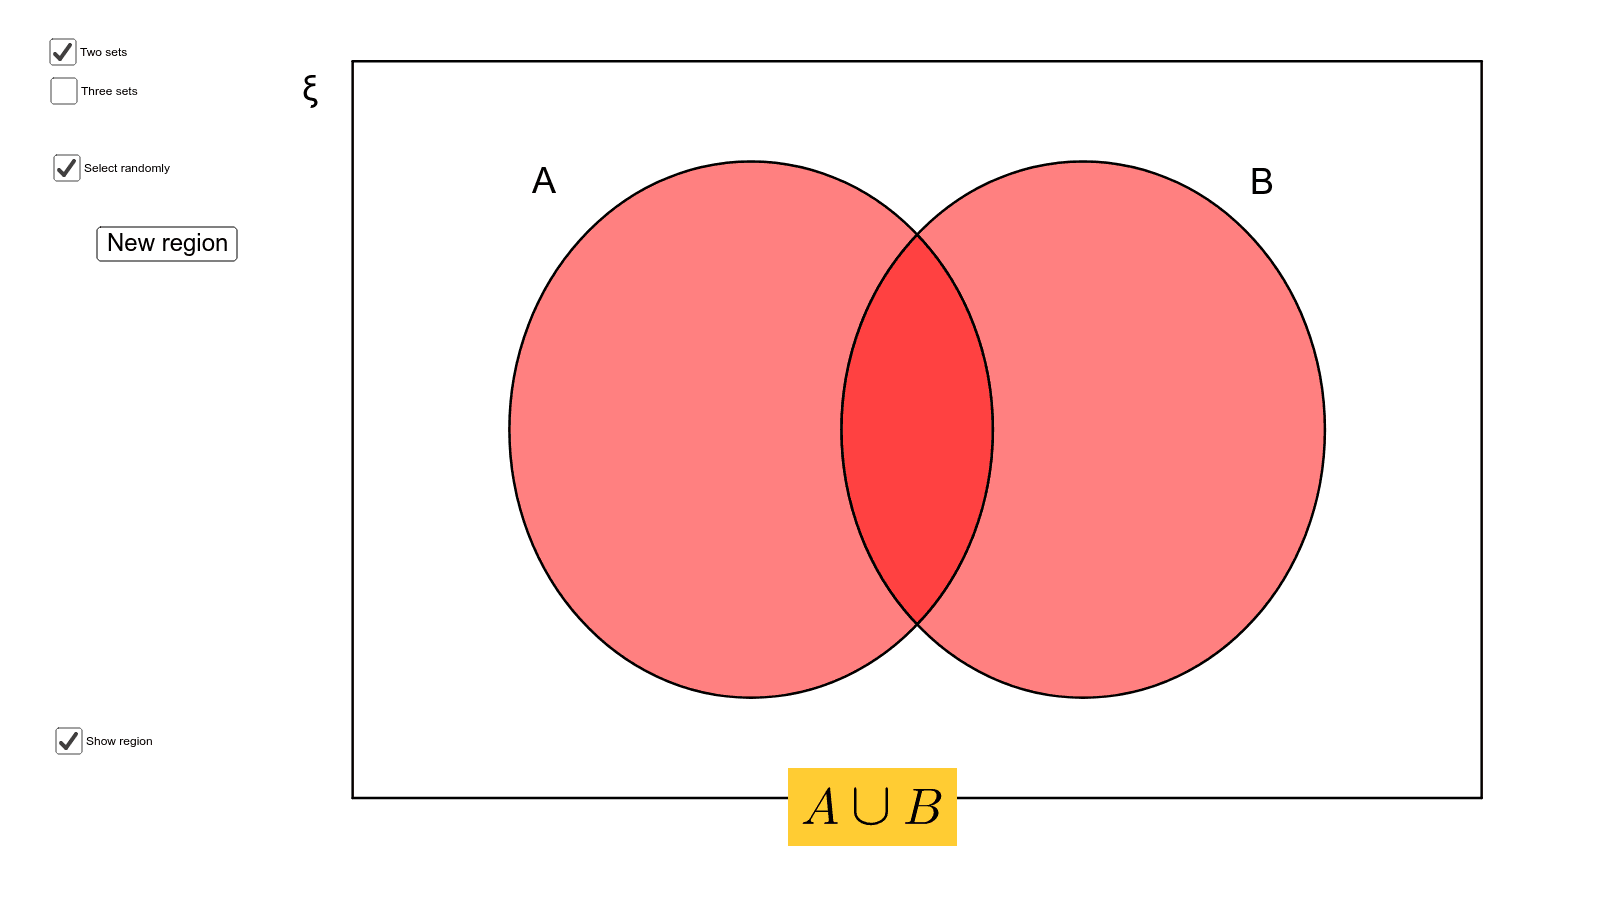
Venn Diagram Shading with 2 and 3 Sets
Loading the math board and drawing, please wait…
This example demonstrates how to draw and shade Venn diagrams for 2 and 3 sets using GeoGebra. It involves core math concepts like set operations, Venn diagram representation, and logical conditional statements. Key GeoGebra commands/objects used include Polygon, Circle, Segment, Intersect, CircleArc, and Random. Suitable for IGCSE set theory and A-Level S1 (Statistics 1).
GeoGebra Commands & Parameters
Polygon(A, B, D, C) → poly1, a, b, d, cCircle(E, G) → eCircle(F, H) → fSegment(A, B) → gSegment(B, D) → hSegment(D, C) → iSegment(C, A) → jIntersect(e, f) → I, J, ,CircleArc(E, I, J) → kCircleArc(E, J, I) → pCircleArc(F, I, J) → qCircleArc(E, J, I) → tCircleArc(F, I, J) → c_1CircleArc(E, I, J) → rCircleArc(F, J, I) → d_1CircleArc(E, J, I) → e_1CircleArc(F, I, J) → f_1Polygon(A, C, D, B) → poly2, a_2, c_2, d_2, b_1Circle(E, G) → g_1Circle(F, H) → h_1Random(1, 8) → i_2Polygon(K, L, 3) → poly3, p_1, q_1, r_1, MCircle(M, m_1) → k_2Circle(K, m_1) → p_2Circle(L, m_1) → q_2Intersect(k_2, p_2, 2) → NIntersect(k_2, p_2, 1) → OIntersect(p_2, q_2, 1) → PIntersect(k_2, q_2, 2) → QIntersect(k_2, q_2, 1) → RIntersect(p_2, q_2, 2) → SCircleArc(K, O, N) → r_2CircleArc(M, N, O) → s_2CircleArc(L, R, Q) → t_2CircleArc(M, Q, R) → c_3CircleArc(L, P, S) → d_3CircleArc(K, S, P) → e_3Polygon(A, C, D, B) → poly4, a_3, c_4, d_4, b_3Circle(M, m_1) → g_3Circle(K, m_1) → h_3Circle(L, m_1) → k_3Random(1, 28) → f_3
AI Drawing Prompt Reference
Draw a Venn diagram with two overlapping circles to show the intersection and union of two sets. Add shading to the edges to highlight different regions. Construct by first drawing the circles, then determining their intersection points, and finally shading the areas to ensure a clear and understandable diagram.
The prompt above was compiled from the original drawing commands and is for reference only.