
Phase Space Exploration
Loading the math board and drawing, please wait…
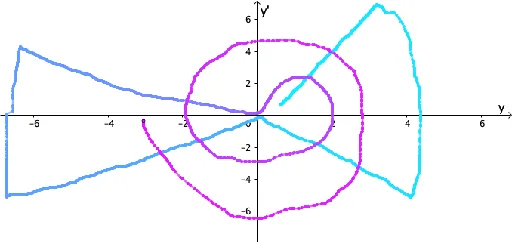
This example demonstrates how to visualize trajectory changes in phase space through dynamic graphics. It involves core mathematical concepts such as derivatives, differential equations, exponential functions, function graphs, integral calculus, statistics, geometry, step functions, and symmetry. The construction uses GeoGebra commands like Segment with objects A, d, B, A_0, B_0, a, A_1, B_1, f, g, r, m. Suitable for high school and above students learning mathematical modeling of complex dynamic systems.
GeoGebra Commands & Parameters
Segment(A_0, A_1) → fSegment(B_0, B_1) → g
AI Drawing Prompt Reference
Create a phase space exploration diagram showing trajectory changes in a dynamic system. Draw two line segments, each connecting an initial point to a final point, representing the evolution of system states from start to end. The two segments should have different directions and lengths to illustrate distinct trajectory paths in phase space. Include coordinate axes or a grid background to enhance the mathematical visualization, suitable for demonstrating concepts like derivatives and differential equations.
The prompt above was compiled from the original drawing commands and is for reference only.