
Parameters of Sine, Cosine, and Tangent Functions
Loading the math board and drawing, please wait…
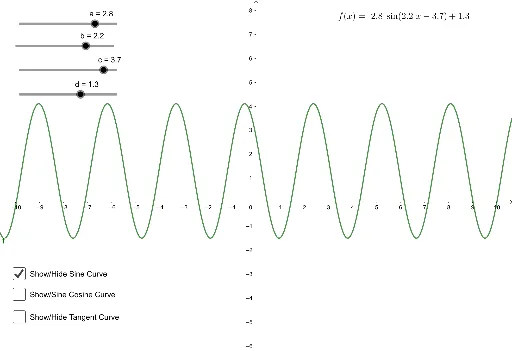
This example demonstrates the investigation of sine, cosine, and tangent curves through parameter manipulation. Key math concepts include trigonometric functions, periodicity, amplitude, phase shift, and the unit circle. GeoGebra commands used are sliders a, b, points c, d, functions f, g, h, texts text1, text2, text3, and objects e, i, j. Suitable for high school students and teachers to understand the effects of parameters on trigonometric graphs.
GeoGebra Commands & Parameters
Numeric a(2.8)Numeric b(2.2)Numeric c(3.7)Numeric d(1.3)f(x) = (a * sin((b * x) - c)) + dg(x) = (a * cos((b * x) - c)) + dh(x) = (a * tan((b * x) - c)) + dBoolean e(true)Boolean i(false)Boolean j(false)
AI Drawing Prompt Reference
Plot the graphs of sine, cosine, and tangent functions by adjusting parameters a, b, c, and d. a controls the amplitude, b affects the period, c is the phase shift, and d is the vertical shift. Draw f(x) = a * sin(b * x - c) + d, g(x) = a * cos(b * x - c) + d, and h(x) = a * tan(b * x - c) + d.
The prompt above was compiled from the original drawing commands and is for reference only.