
Ogive Curve: Geometric Construction of Cumulative Frequency Graph
Loading the math board and drawing, please wait…
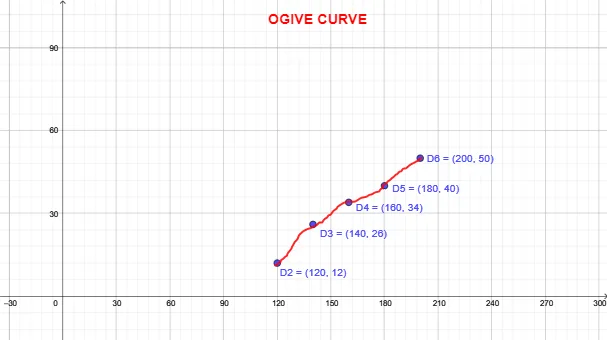
This example shows how to construct an ogive curve—a cumulative frequency graph of normally distributed data—using GeoGebra’s geometric tools, allowing users to observe the step‑wise evolution dynamically. The core mathematics involved include the cumulative distribution function, step functions, statistical moments such as mean and variance, and the discrete accumulation of natural‑number sequences. In the construction, a set of points (A1, B1, C1, D1, …) and the stroke1 line are defined, with sliders controlling parameters that transform raw data into a stair‑step plot and then into a smooth Euclidean curve. The workflow highlights how GeoGebra commands can link algebraic data to geometric objects, providing an intuitive visual bridge between statistics and geometry. This resource is aimed at high‑school and early‑university students studying statistics, mathematical analysis, or computational geometry, and it serves as an effective tool for illustrating the geometric nature of cumulative frequency graphs and their role in data visualization.
GeoGebra Commands & Parameters
1214861012C2 + B3C3 + B4C4 + B5C5 + B6(120, 12)(140, 26)(160, 34)(180, 40)(200, 50)PolyLine[(118.84333380013865,11.14186361819448), (118.84333380013865,11.14186361819448), (NaN,NaN), (118.84333380013865,11.14186361819448), (119.93566987145182,11.377590322967048), (120.66389391899395