
Normal Distribution Probability Calculator
Loading the math board and drawing, please wait…
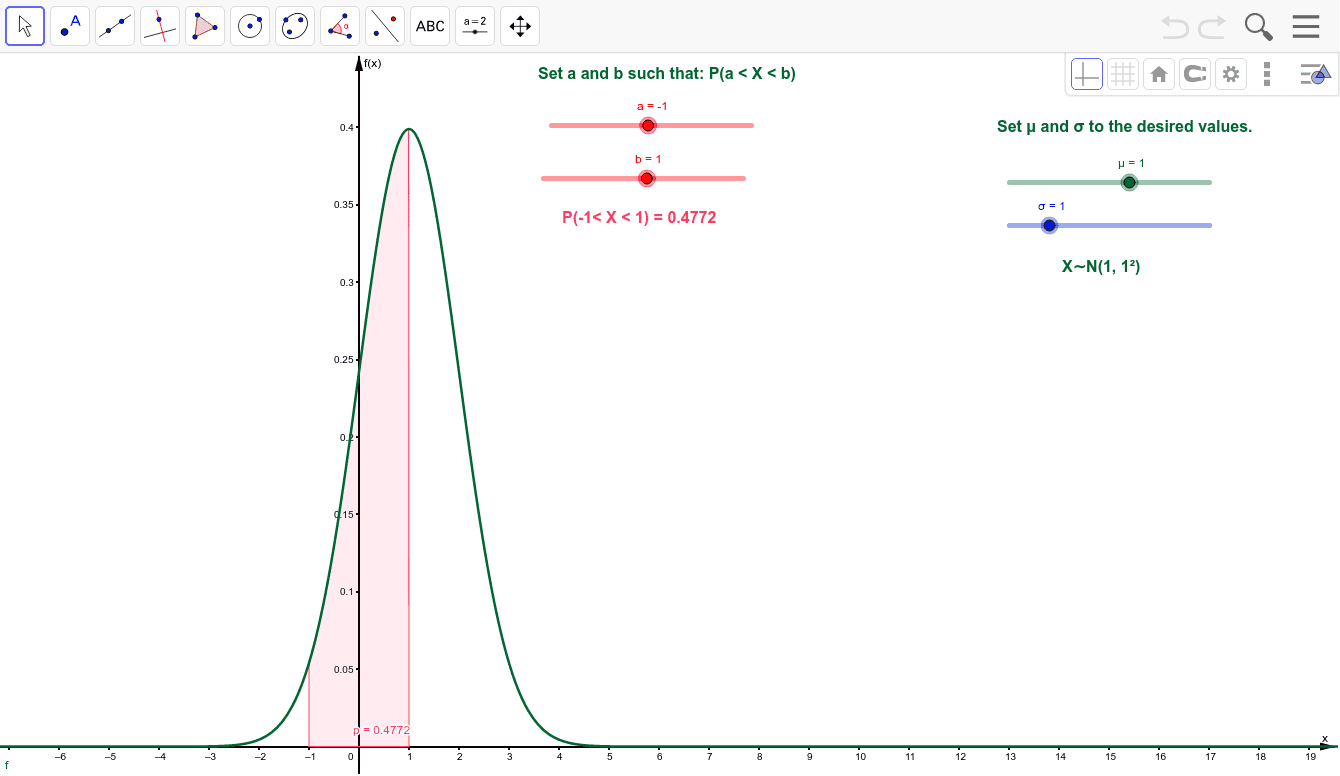
This interactive GeoGebra example demonstrates a probability calculator for the normal distribution. Users can adjust the mean μ and standard deviation σ to see how the bell-shaped curve changes, and compute the probability that a random variable falls within a specified interval [a, b]. The core mathematical concepts include the normal distribution, probability density function, cumulative distribution function, and the use of definite integrals to calculate probabilities. The construction uses the Normal command to generate the normal curve and the Integral command to compute the area under the curve over the interval, which represents the probability. Dynamic text objects display the parameters μ, σ, a, b, and the resulting probability p. This resource is ideal for high school or introductory college statistics courses, helping students visualize the relationship between the normal curve, integration, and probability, and can be used for classroom demonstrations or self-directed exploration.
GeoGebra Commands & Parameters
Normal(μ, σ, x) → fIntegral(f, a, b) → p