
Median-Median Line vs LSRL for Ten Points
Loading the math board and drawing, please wait…
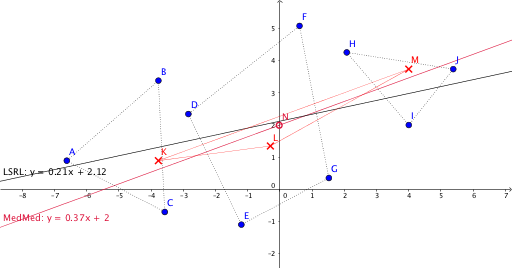
This example demonstrates the difference between the median-median line and the least-squares regression line (LSRL) fitted to ten scattered data points. The core mathematical concepts include robust regression, least-squares estimation, medians, centroids, and convex hulls as geometric tools in data analysis. Construction highlights: using GeoGebra commands Sort and Take to organize the points, ConvexHull and Centroid to build the convex hull and centroid, Line and FitLineY to generate the median-median line and LSRL respectively, with lists list1 through list5 storing intermediate results, and final objects MedMed and LSRL labeling the two fitted lines. Suitable for high school or college statistics courses, this example helps students visually compare the sensitivity of the two regression methods to outliers and understand the geometric interpretation of data fitting.
GeoGebra Commands & Parameters
Sort({A, B, C, D, E, F, G, H, I, J}) → list1Take(list1, 1, 3) → list2Take(list1, 4, 7) → list3Take(list1, 8, 10) → list4ConvexHull(list2) → graph1ConvexHull(list3) → graph2ConvexHull(list4) → graph3ConvexHull({K, L, M}) → graph4Centroid(Polygon[K, L, M]) → NSort({K, L, M}) → list5Line(N, Line[Element[list5, 1], Element[list5, 3]]) → MedMedFitLineY(list1) → LSRL