
Mean and Standard Deviation of a Data Set
Loading the math board and drawing, please wait…
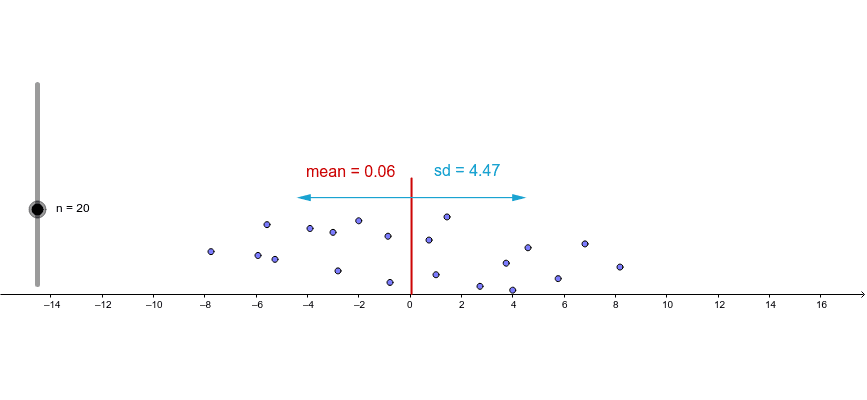
This example demonstrates the distribution of data points with a red line representing the mean. Using GeoGebra commands such as Point, Segment, and Vector, one can visually understand the concepts of mean and standard deviation in statistics. Suitable for high school and above students.
GeoGebra Commands & Parameters
Point(C1) → D1Point(C2) → D2Point(C3) → D3Point(C4) → D4Point(C5) → D5Point(C6) → D6Point(C7) → D7Point(C8) → D8Point(C9) → D9Point(C10) → D10Point(C11) → D11Point(C12) → D12Point(C13) → D13Point(C14) → D14Point(C15) → D15Point(C16) → D16Point(C17) → D17Point(C18) → D18Point(C19) → D19Point(C20) → D20Cell(6, n) → muCell(7, n) → stdevPoint(C21) → D21Point(C22) → D22Point(C23) → D23Point(C24) → D24Point(C25) → D25Point(C26) → D26Point(C27) → D27Point(C28) → D28Point(C29) → D29Point(C30) → D30Segment((mu, 0), (mu, (h * (n + 10)))) → cVector((mu, (h * (n + 5))), (mu - stdev, (h * (n + 5)))) → vVector((mu, (h * (n + 5))), (mu + stdev, (h * (n + 5)))) → uPoint(C31) → D31Point(C32) → D32Point(C33) → D33Point(C34) → D34Point(C35) → D35Point(C36) → D36Point(C37) → D37Point(C38) → D38Point(C39) → D39Point(C40) → D40Cell(5, 1) → aSD(E$1:E1) → G1SD(E$1:E2) → G2SD(E$1:E3) → G3SD(E$1:E4) → G4SD(E$1:E5) → G5SD(E$1:E6) → G6SD(E$1:E7) → G7SD(E$1:E8) → G8SD(E$1:E9) → G9SD(E$1:E10) → G10SD(E$1:E11) → G11SD(E$1:E12) → G12SD(E$1:E13) → G13SD(E$1:E14) → G14SD(E$1:E15) → G15SD(E$1:E16) → G16SD(E$1:E17) → G17SD(E$1:E18) → G18SD(E$1:E19) → G19SD(E$1:E20) → G20SD(E$1:E21) → G21SD(E$1:E22) → G22SD(E$1:E23) → G23SD(E$1:E24) → G24SD(E$1:E25) → G25SD(E$1:E26) → G26SD(E$1:E27) → G27SD(E$1:E28) → G28SD(E$1:E29) → G29SD(E$1:E30) → G30SD(E$1:E31) → G31SD(E$1:E32) → G32SD(E$1:E33) → G33SD(E$1:E34) → G34SD(E$1:E35) → G35SD(E$1:E36) → G36SD(E$1:E37) → G37SD(E$1:E38) → G38SD(E$1:E39) → G39SD(E$1:E40) → G40Mean(E$1:E2) → F2Mean(E$1:E1) → F1Mean(E$1:E3) → F3Mean(E$1:E4) → F4Mean(E$1:E5) → F5Mean(E$1:E6) → F6Mean(E$1:E7) → F7Mean(E$1:E8) → F8Mean(E$1:E9) → F9Mean(E$1:E10) → F10Mean(E$1:E11) → F11Mean(E$1:E12) → F12Mean(E$1:E13) → F13Mean(E$1:E14) → F14Mean(E$1:E15) → F15Mean(E$1:E16) → F16Mean(E$1:E17) → F17Mean(E$1:E18) → F18Mean(E$1:E19) → F19Mean(E$1:E20) → F20Mean(E$1:E21) → F21Mean(E$1:E22) → F22Mean(E$1:E23) → F23Mean(E$1:E24) → F24Mean(E$1:E25) → F25Mean(E$1:E26) → F26Mean(E$1:E27) → F27Mean(E$1:E28) → F28Mean(E$1:E29) → F29Mean(E$1:E30) → F30Mean(E$1:E31) → F31Mean(E$1:E32) → F32Mean(E$1:E33) → F33Mean(E$1:E34) → F34Mean(E$1:E35) → F35Mean(E$1:E36) → F36Mean(E$1:E37) → F37Mean(E$1:E38) → F38Mean(E$1:E39) → F39Mean(E$1:E40) → F40Point(C41) → D41SD(E$1:E41) → G41Mean(E$1:E41) → F41Point(C42) → D42SD(E$1:E42) → G42Mean(E$1:E42) → F42Point(C43) → D43SD(E$1:E43) → G43Mean(E$1:E43) → F43Point(C44) → D44SD(E$1:E44) → G44Mean(E$1:E44) → F44Point(C45) → D45SD(E$1:E45) → G45Mean(E$1:E45) → F45Point(C46) → D46SD(E$1:E46) → G46Mean(E$1:E46) → F46Point(C47) → D47SD(E$1:E47) → G47Mean(E$1:E47) → F47Point(C48) → D48SD(E$1:E48) → G48Mean(E$1:E48) → F48Point(C49) → D49SD(E$1:E49) → G49Mean(E$1:E49) → F49Point(C50) → D50SD(E$1:E50) → G50Mean(E$1:E50) → F50
AI Drawing Prompt Reference
Draw 20 data points in a coordinate system, with a red line representing the mean and vectors showing the standard deviation ranges on both sides to illustrate data distribution. Start by plotting the data points, then draw the red line for the mean, and finally add vectors for the standard deviations to help understand the concepts of mean and standard deviation in statistics.
The prompt above was compiled from the original drawing commands and is for reference only.