
LR7-01-XT1 (Midpoint of a line segment)
Loading the math board and drawing, please wait…
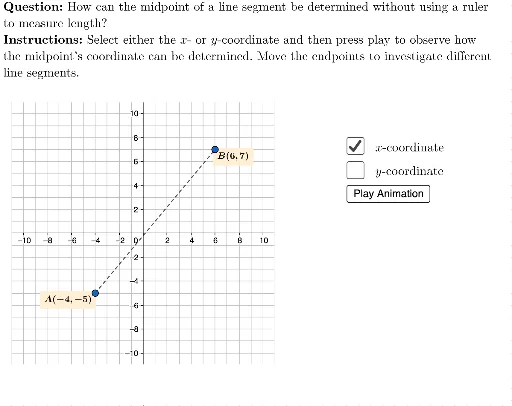
This interactive GeoGebra example demonstrates how the midpoint of a line segment is determined, visually showing that the midpoint divides the segment into two equal halves. The core mathematical concepts include line segments, midpoints, length measurement, and coordinate representation. In terms of construction, the example uses GeoGebra commands such as Polygon, Segment, Midpoint, Length, Point, Angle, Rotate, Line, and Vector, along with multiple sliders (e.g., sliderDrawFirstHalfSegment, sliderDrawSecondHalfSegment, sliderXFirstHalf) to control the display of segment halves and dynamic movement. LaTeX text and coordinate points (xCoordinate, yCoordinate) are also used to support explanations. This resource is suitable for middle or high school students learning plane geometry and coordinate geometry, and can be used for classroom demonstrations or self-directed exploration to understand the midpoint formula and its application in the coordinate plane.
GeoGebra Commands & Parameters
Polygon({(-6, -1), (-3, -1), (-3, -9), (-6, -9)}) → pointABoxPolygon({(7, 10), (3, 10), (3, 1), (7, 1)}) → pointBBoxPolygon({(-11, -11), (-11, 11), (11, 11), (11, -11)}) → viewBoxLaTeX((((("\text{" * QUESTION) * "\\") * INSTRUCTIONS) * "}")) → TEXTPointIn(pointABox) → APointIn(pointBBox) → BSegment(A, B) → segmentMidpoint(segment) → midpointLength(Segment[A, midpoint]) → lengthOfHalfSegmentPoint(Circle[A, sliderDrawFirstHalfSegment]) → CAngle(C, A, midpoint) → αRotate(Segment[A, Point[Circle[A, sliderDrawFirstHalfSegment]]], α, A) → firstHalfSegmentRotate(firstHalfSegment, sliderDrawSecondHalfSegment°, midpoint) → secondHalfSegmentLine(A, x = 0) → xLineALine(B, x = 0) → xLineBSegment(D, E) → segmentXMidpoint(segmentX) → midpointXLength(Segment[D, midpointX]) → lengthOfHalfXPoint(Circle[D, sliderXFirstHalf]) → FSegment(D, F) → firstHalfXRotate(D, sliderXSecondHalf°, midpointX) → D'Rotate(F, sliderXSecondHalf°, midpointX) → F'Segment(D', F') → secondHalfXVector(D + (0, (-sliderXMove)), D + (0, (-sliderXMove)) + (sliderXArrows, 0)) → x1VectorVector(E + (0, (-sliderXMove)), E + (0, (-sliderXMove)) + ((-sliderXArrows), 0)) → x2VectorLaTeX("\text{\(x\)-coordinate}") → xLabelLaTeX("\text{\(y\)-coordinate}") → yLabelLine(A, y = 0) → yLineALine(B, y = 0) → yLineBLaTeX(("x=" * x(A))) → xLineALabelLaTeX(("\vphantom{-}x=" * x(B))) → xLineBLabelLaTeX(("y=" * y(A))) → yLineALabelLaTeX(("y=" * y(B))) → yLineBLabelSegment(G, H) → segmentYPoint(Circle[G, sliderYFirstHalf]) → IMidpoint(segmentY) → midpointYLength(Segment[G, midpointY]) → lengthOfHalfYRotate(Segment[G, Point[Circle[G, sliderYFirstHalf]]], 90°, G) → firstHalfYRotate(firstHalfY, sliderYSecondHalf°, midpointY) → secondHalfYLaTeX((((("\text{The \(y\)-coordinate of the midpoint is halfway between the lines \(" * yLineALabel) * "\) and \(") * yLineBLabel) * "\).}")) → ySummaryLaTeX((((("\text{The \(x\)-coordinate of the midpoint is halfway between the lines \(" * xLineALabel) * "\) and \(") * xLineBLabel) * "\).}")) → xSummaryVector(G + ((-sliderYMove), 0), G + ((-sliderYMove), 0) + (0, sliderYArrows)) → y1VectorVector(H + ((-sliderYMove), 0), H + ((-sliderYMove), 0) + (0, (-sliderYArrows))) → y2VectorLaTeX(("A" * A)) → aLabelLaTeX(("B" * B)) → bLabel